@Patrick M. Hausen , that did it THANKS.
For anyone interested, the final version of the script is as follows:
I set a cronjob in Truenas to run this script every minute and now the UPS status is available in grafana.
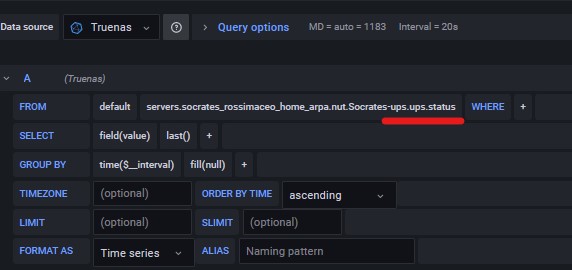
In grafana just create a "Stat" panel and look for the field that ends in "ups.status"

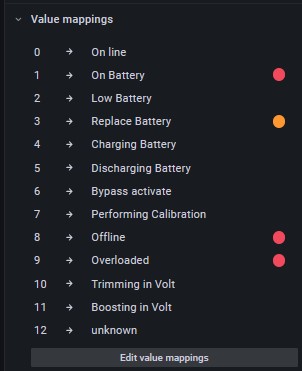
However, this will only give you a numeric value. In order to get the actual status, we need to add some "Value Mappings" as follows:

The end result is a panel with the UPS status

For anyone interested, the final version of the script is as follows:
Code:
#! /bin/sh
#script to obtain the UPS status and send it
#to InfluxDB and Grafana
#
#by Ragametal in collaboration with Patrick M. Hausen 07-22-2022

##################################################################
# modify the variables below to meet your needs

# change HOST to match the IP of the InfluxDB jail
HOST="10.0.0.24"

# change the PORT to match the InfluxDB port (default is shown)
PORT="2003"

# change PREFIX to match the InfluxDB items (default is shown)
PREFIX="servers"

# change the UPS to match the name of the UPS in Truenas
UPS="Socrates-ups"

# end of variables

# start of script
# DO NOT MODIFY BELOW THIS LINE unless you understand the code
#####################################################################

# get current time in Unix timestamp format, save in $time
time=$(/bin/date +%s)
# get hostname, replace "." with "_", save in $hostname
hostname=$(/bin/hostname | /usr/bin/tr '.' '_')

# - read the UPS Status value and save it to the variable $upsstatus
upsstatus=$(/usr/local/bin/upsc ${UPS} | /usr/bin/awk '/ups\.status:/ { print $2 }')

case ${upsstatus} in
    OL)
        # online
        numstatus=0
    ;;
    OB)
        # on battery
        numstatus=1
    ;;
    LB)
        # low battery
        numstatus=2
    ;;
    RB)
        # replace battery
        numstatus=3
    ;;
    CHRB)
        # charging battery
        numstatus=4
    ;;
    DISCHRB)
        # discharging battery
        numstatus=5
    ;;
    BYPASS)
        # bypass circuit is active
        numstatus=6
    ;;
    CAL)
        # performing calibration
        numstatus=7
    ;;
    OFF)
        # offline
        numstatus=8
    ;;
    OVER)
        # overloaded
        numstatus=9
    ;;
    TRIM)
        # trimming incoming voltage
        numstatus=10
    ;;
    BOOST)
        # boosting incoming voltate
        numstatus=11
    ;;
    *)
        # unknown
        numstatus=12
    ;;
esac

# output UPS status values in graphite plain text format
echo "${PREFIX}.${hostname}.nut.${UPS}.ups.status ${numstatus} ${time}" | /usr/bin/nc "${HOST}" "${PORT}" -w2
I set a cronjob in Truenas to run this script every minute and now the UPS status is available in grafana.
In grafana just create a "Stat" panel and look for the field that ends in "ups.status"
However, this will only give you a numeric value. In order to get the actual status, we need to add some "Value Mappings" as follows:
The end result is a panel with the UPS status
