Grafana, Influxbd, and the paucity of available variables

NumberSix

Contributor
Joined
Apr 9, 2021
Messages
188
Hi
I have just reinstalled the latest available Grafana and Influxdb to TrueNAS after a break of two or three years and I am seeing a crippling paucity of useful variables available which in turn frustrate my hope to create many useful data panels within Grafana.

I recall I was using Grafana 7 in the past, and now it's version 9.3.8 - manually installed following a great guide on this forum. Influxdb - I can no longer recall which version was current 3 years ago but it is now on version 1.8.10. which I have installed.

Here's what I am finding.

Grafana now only reports variables pertaining to CPU activity and temperature, and Disk activity and temperature. There are no variables on network activity, no variables on memory utilisation, no variables on - anything but the cpu and the disks. This makes for a bit of a barren Grfana Dashboard. Here's my old Dashboard, which I have modified only slightly, and reconnected to the new variables where povvible. As you see, I have the central column of panels working fine, but to the right, nothing (the storage panel os currently wrong but that's irrelevant - it's still a Disk variable), and to the left - nothing either, but the time. This is all I have now.
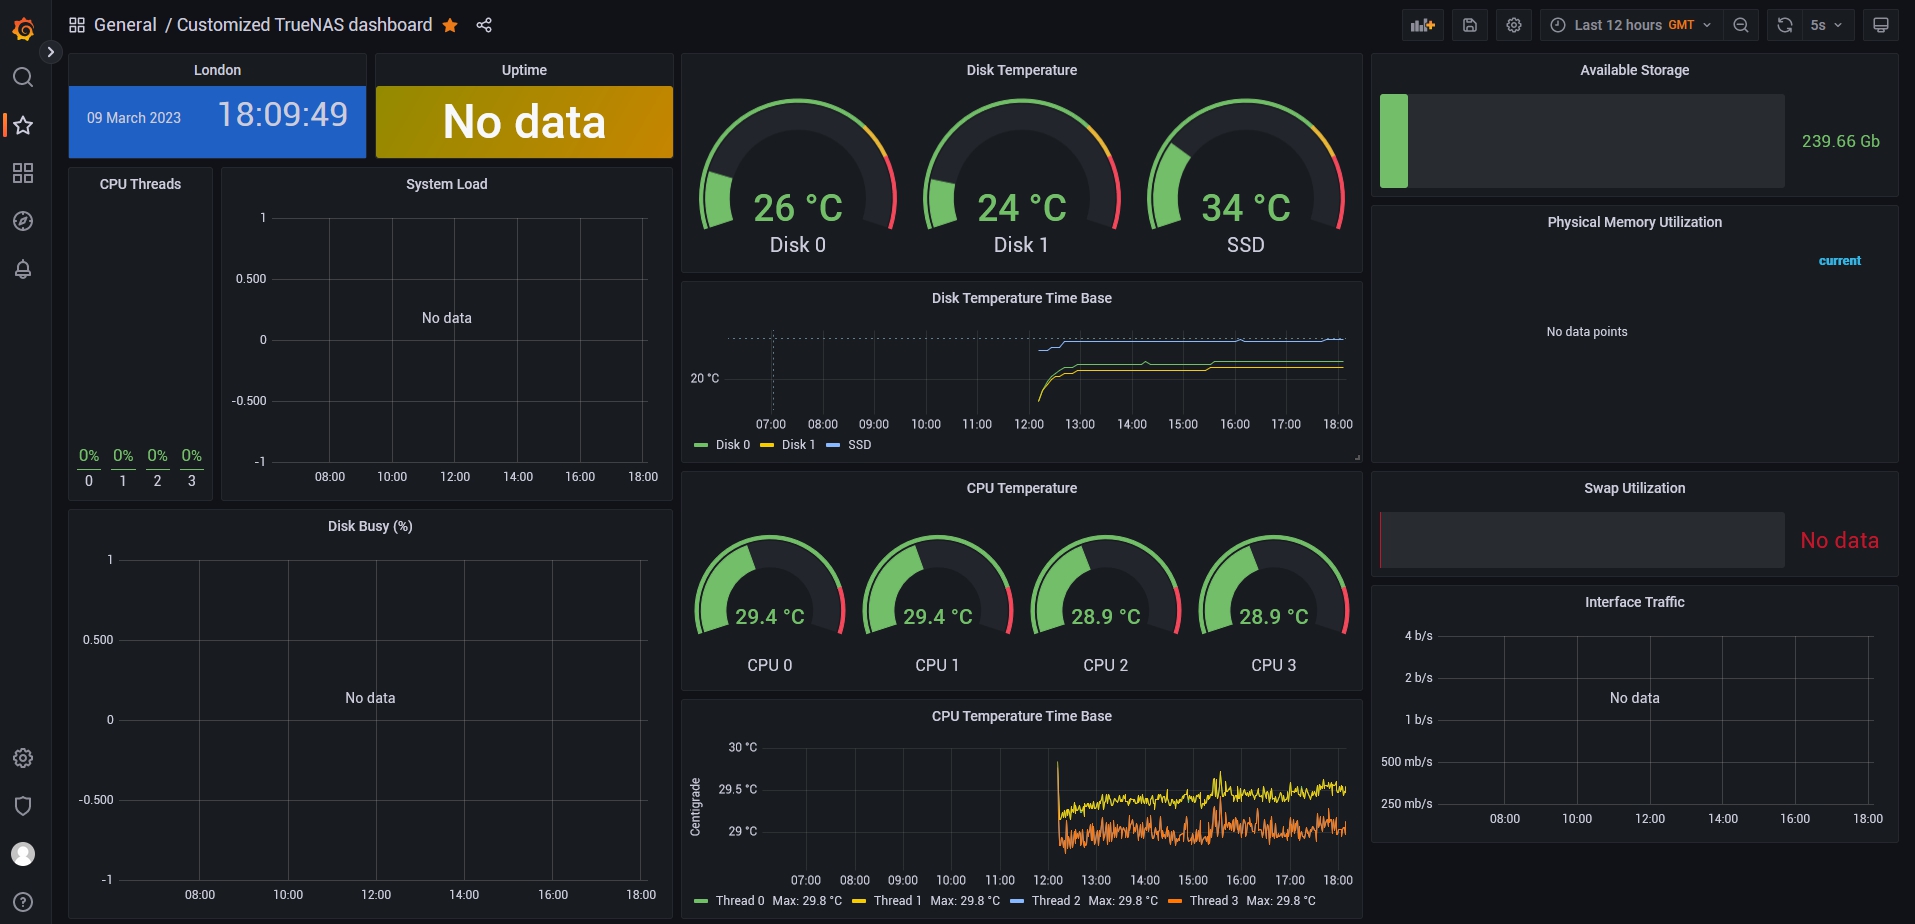
screenshot.6.jpg


Does anyone have any idea why Influxdb is reporting such a limited set of what I know it (historically) could report? Does anyone have any idea as to how I might persuade it to get more generous and report on metrics like networking and CPU loadings and such? I know this is an obscure ask, but there are some smart and experienced people on this forum, so I am hoping someone might just know how to proceed!

Thank you.
 
Last edited:

Patrick M. Hausen

Hall of Famer
Joined
Nov 25, 2013
Messages
7,776
InfluxDB is just a time series database. It does nothing to monitor your TrueNAS. You need to actively send it data. What exactly is performing that in your case?

What does a "show series" of your Influx database display?
 

NumberSix

Contributor
Joined
Apr 9, 2021
Messages
188
InfluxDB is just a time series database. It does nothing to monitor your TrueNAS. You need to actively send it data. What exactly is performing that in your case?

What does a "show series" of your Influx database display?

Hi
I am afraid I can't tell you what performs that function as my understanding is very incomplete. There is a component called Graphite that has a config section in the Influxdb config - it could be that?

I don't know how to do a "show series". Influxdb has no interface that I've encountered so far. Again, the config has a http section, but it'd be trial & error to see if I can edit that into giving me a usable interface. I hope that's the right way to go!

Footnote
I have now fixed the problem and I am indebted to you Patrick for prompting me to think more about Graphite. Whilst I don't pretend to fully understand the mechanisms involved here, I had the idea of connecting Grafana to Graphite as a data source (as I noted, it was already using Influxdb as a data source). Once I did that, an unknown number of additional variables became available. Note - this extra step is NOT part of the setup page refered (& linked) to at the top of this page. Why a) they were not available from Influx, if Graphite was the source to Influx already, I have no idea, and b) note these Graphite additions do not appear as a 'From' pull-down menu as they do from Influx, rather, you have to guess what might be there, and type terms like 'load' into the input field and voila - all variables that include the search term are listed, so you can find what you need if you can guess an element of it's name correctly. Um. Keeps life interesting. Regardless of it's peculiarities, between Graphite and Influxdb I can access all the required variables to create a usefully detailed Grafana page now.
 

Patrick M. Hausen

Hall of Famer
Joined
Nov 25, 2013
Messages
7,776
And where does the data come from? Something is sending data to (possibly) Influx and Graphite. Graphite is yet another time series database.

The interface to Influx is called "influx" - command line.

Then you type use <name of database>; followed by show series;.
 

NumberSix

Contributor
Joined
Apr 9, 2021
Messages
188
Thank you Patrick
I did as you suggested, and behold! - I was flooded with variables captured by (use ) Graphite. So much so that, while some of them are fairly clear in meaning, the vast majority are not at all clear. This prompts a further question. Is there any documentation out there that might explain values like (and I have selected this at random):
servers.truenas_local.disk-ada0.disk_io_time.weighted_io_time
servers.truenas_local.disk-ada0.disk_octets.read
servers.truenas_local.disk-ada0.disk_octets.write

I am finding Google isn't much help on this.

Thank you.
 

NumberSix

Contributor
Joined
Apr 9, 2021
Messages
188
Hi
Yes I did thank you.
It doesn't seem to help. I sifted through the contents - nothing on variables. So I used the search fascility on the page with 'aggregation-cpu-sum.gauge-user' as a test query. Lots of results based on elements from it, like 'cpu' or 'user' getting matched, but nothing that actually discusses that term.

Thinking back to Patrick's point; I still don't know what process is actually retieving these assorted measurements. Whatever is doing that job is presumably the thing that names the values / assigns the values to pre-determined variable names, before storing them in either Graphite or Influx. This is all above my pay grade. I don't understand why, for example, Grafana would need 2 databases to store these results since they are apparently both time base databases, but then, what do I know (not enough, clearly).

Thanks for the suggestion though!
 

SMnasMAN

Contributor
Joined
Dec 2, 2018
Messages
177
I run my own grafana / graphite / influxDB v1 - setup (ie didnt follow the guide you are referring to, so i may be a bit off base - but you can get ALOT of stats, easily).

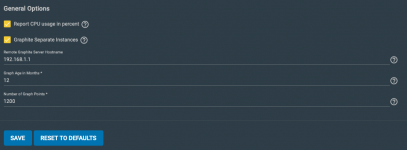
Stock / as-is , TrueNas can send alot of data to graphite. you just need to enable / setup this part of the settings page (and then use grafana to access the GRAPHITE datasource):
1678474681287.png


You set this IP to your graphite server (which i assume is also running on your grafana VM).

then to access the data over in grafana (you access the graphite data source) like this:
1678474948145.png


It may not be plug and play on whatever pre-setup dashboard your currently using (or maybe it will be), so you may have to make a new dashboard, or edit that existing one. (you can ofcourse have both influx and graphite panels , in the same dashboard, in grafana)
 

Patrick M. Hausen

Hall of Famer
Joined
Nov 25, 2013
Messages
7,776
I was away for a couple of days. I'll get back into this topic later today or possibly tomorrow. Let's see if I can help.

Meanwhile, @NumberSix please post the content of /usr/local/etc/influxd.conf in your Grafana jail and the output of pkg info in that same jail. Thanks.

Also, to solve the puzzle of the data source: are you trying to monitor the TrueNAS system itself, on which the Grafana jail is running?
 
Last edited:

NumberSix

Contributor
Joined
Apr 9, 2021
Messages
188
I was away for a couple of days. I'll get back into this topic later today or possibly tomorrow. Let's see if I can help.

Meanwhile, @NumberSix please post the content of /usr/local/etc/influxd.conf in your Grafana jail and the out put of pkg info in that same jail. Thanks.

Also, to solve the puzzle of the data source: are you trying to monitor the TrueNAS system itself, on which the Grafana jail is running?
Hi
Thank you for your assistance Patrick.
Here is the output from pkg info:

root@grafana:/usr/local/etc # pkg info
Code:
ca_root_nss-3.86               Root certificate bundle from the Mozilla Project
gettext-runtime-0.21.1         GNU gettext runtime libraries and programs
grafana9-9.3.8                 Dashboard and graph editor for multiple data stores
indexinfo-0.3.1                Utility to regenerate the GNU info page index
influxdb-1.8.10_9              Open-source distributed time series database
nano-7.1                       Nano's ANOther editor, an enhanced free Pico clone
pkg-1.19.0                     Package manager

And the answer is Yes, I am trying to monitor the same TrueNAS system on which Grafana Jail is running.

Now a lame response on your request for details of the conf file. I barely know how to use the Nano editor. I have no idea how to select all and copy the contents from that environemt such that I can paste it back into the Windows environment that I work in generally - sorry. I can select and copy what's on screen, but as soon as I scroll, the selected area becomes de-selected. That said, I concatonated a couple of screen's worth together to give you this section which I guess is key, and the only part of this section that I have edited from it's default.
Code:
[[graphite]]
  # Determines whether the graphite endpoint is enabled.
  enabled = true
  database = "graphite"
  # retention-policy = ""
  bind-address = ":2003"
  protocol = "tcp"
  consistency-level = "one"

  # These next lines control how batching works. You should have this enabled
  # otherwise you could get dropped metrics or poor performance. Batching
  # will buffer points in memory if you have many coming in.

  # Flush if this many points get buffered
  batch-size = 5000

  # number of batches that may be pending in memory
  batch-pending = 10

  # Flush at least this often even if we haven't hit buffer limit
  batch-timeout = "1s"


Note, since you gave me that excellent pointer:
Then you type use <name of database>; followed by show series;.
I have had no shortage of access to all the data I could wish for, so really, I can mark this issue as resolved. There is the curious 'academic' question as to what is retrieving the datapoints, but as far as practical needs are concerned, you have provided a very usable solution already!
 

Patrick M. Hausen

Hall of Famer
Joined
Nov 25, 2013
Messages
7,776
OK, so you are on board (I hope) with the concept of a data/metric collector, a time series database, and the visualizing tool that queries that database to produce fancy graphs.

1.

You are not running Graphite. There is no Graphite installed on your system according to pkg info.

2.

The collector is most probably the TrueNAS CORE builtin collectd. At least at one time in the past you navigated to System > Reporting in the UI and pointed that builtin function to your InfluxDB/Grafana jail. Like this:

Bildschirmfoto 2023-03-14 um 15.15.33.png

I recommend activating "Graphite Separate Instances". This means that collectd will not send metrics with the label "disk-ada0", which can be more difficult to parse in Grafana in the end but instead as "disk.ada0". Dots separate individual fields in InfluxDB and Influx will take care of cutting everything into pieces appropriately.

3.

Now where does the Graphite confusion come from? Easy. The section from influxd.conf defines a connector (for ingestion of data) that uses the Graphite plain text protocol. That's all. It's still collectd --> influxd. But they use a format that was first defined by a different time series DB product named Graphite. Both collectd and influxd support that and for some reason this format is what iX picked for the builtin reporting. So we adapt and tell influxd to accept just that.

Additionally the database is named "graphite". Just as MySQL or Postgres do Influx will happily manage multiple databases in a single server process. So it needs a name. If you change the line database = "graphite" to database = "truenas", it will be named "truenas". You must keep the [[graphite]] header, of course. That defines that it is a Graphite plain text compatible connector.

4.

So how does all of this play together? The reporting service sends the time series database a continuous series of strings of the form "foo.bar.baz.mumble <measurement> <timestamp>" and the time series DB files that away for use by some program like Grafana.

The semantics of what goes into foo, bar, baz, mumble, respectively are completely arbitrary. The sending service defines some format and we need to tell InfluxDB how to parse that.

That goes into the "templates" section in influxd.conf.

5.

Templating. Mine looks like this:

Code:
  templates = [
    "servers.* .hostname.resource.instance.measurement*",
  ]


That tells InfluxDB that every line starts with the string "servers", because that's what iX decided to do. It's called a prefix. I am not quite sure what it is actually good for but possibly you can send different data using different prefixes and select different templates that way.

I named the parts of the data that I want to parse in Grafana later hostname, resource, instance and measurement, respectively.

For example (from show series):

Code:
disk_octets.read,hostname=freenas2_ettlingen_hausen_com,instance=ada0,resource=disk
if_octets.rx,hostname=freenas_ettlingen_hausen_com,instance=igb0,resource=interface
temperature,hostname=freenas_ettlingen_hausen_com,instance=0,resource=cputemp


So that's e.g. disk octets read per second, a variable named "resource" is set to "disk" and a variable named "instance" is set to "ada0".
The next two examples are network octets received for igb0 and CPU temperature for core 0.

6.

Graphing - in Grafana I can reference the parts like this:

Bildschirmfoto 2023-03-14 um 15.47.28.png

"From default" means use the default data source. That's the database named "graphite" but really is InfluxDB. "temperature" is the measurement I want, see the series above. I filter by "resource = cputemp". "resource" is a name I defined in the influxd.conf template above, could have named it "foo". Whatever makes sense to you. This way the disk temperatures are separated from the CPU temperatures etc. The "hostname" match refers to a Grafana variable so I can pick from multiple hosts in a small drop down menu at the top of the dashboard.

"Group by tag(instance)" means draw graphs for CPUs 0, 1, 2, ... up to the number of cores or ada0, ada1, ada2, ... up to the number of disks. Again I named that thing "instance" in the template so now I can refer to "instance" in Grafana.


That's it for now, hope that clears things up a bit. I am by no means an expert with these products. Just invested enough time to get the graphs I wanted out of my NAS systems, OPNsense, etc.


Kind regards,
Patrick

P.S. Don't use the UI builtin shell function. It's broken as you found out trying to copy & paste. Use SSH instead. Client depending on your desktop OS ...
 
Last edited:

NumberSix

Contributor
Joined
Apr 9, 2021
Messages
188
3.

Now where does the Graphite confusion come from? Easy. The section from influxd.conf defines a connector (for ingestion of data) that uses the Graphite plain text protocol. That's all. It's still collectd --> influxd. But they use a format that was first defined by a different time series DB product named Graphite. Both collectd and influxd support that and for some reason this format is what iX picked for the builtin reporting. So we adapt and tell influxd to accept just that.

Additionally the database is named "graphite". Just as MySQL or Postgres do Influx will happily manage multiple databases in a single server process. So it needs a name. If you change the line database = "graphite" to database = "truenas", it will be named "truenas". You must keep the [[graphite]] header, of course. That defines that it is a Graphite plain text compatible connector.


P.S. Don't use the UI builtin shell function. It's broken as you found out trying to copy & paste. Use SSH instead. Client depending on your desktop OS ...

Hi Patrick!
First of all, please let me say that huge thanks and enourmous gratitude ae due to you for giving such a detailed insight into the workings of Grafana and it's back end data display mechanics. More than just procedural, but educational too - so thank you - hugely appreciated!! Unsurprisingly perhaps I have both observations and questions. My number here does not relate to yours as I have fewer points to cover.

1.
Your item 3 (above). Despite several re-readings I don't quite follow you. I think you're saying tha the mention of database = "graphite" simply says 'use the data format convention that graphite uses'. Ok, that I understand, and I understand you saying that iX standardised on that format. Fine so far. So then, what does renaming database = "graphite" to database = "truenas" achieve? Surely they are, in effect, synonyms for the same data format? Further to that, you say "it needs a name" - but if the two are effectively synonymous, and given that it already has a name (grafana), what did changing it to 'truenas' change?

2.
You note that collectd is probably the data collector here. To make my understanding muddier, there is a section immediately following the header that looks like this:
Code:
[[collectd]]
  # enabled = false
  # bind-address = ":25826"
  # database = "collectd"
  # retention-policy = ""
  #

So I am wondering why this is all commented out if the collectd function is active doing the data collection? Is it that we let collectd do the collecting but tell it (above) to actually store the notation in graphite/truenas format?

3.
Despite thinking that changing my Grafana innards from the working setup I had to follow your steps, would result in breaking it, I decided to follow your advice anyway, partly as a learning exercise and partly to feel I was finally doing it 'the right way'. However, prior to getting as far as setting up the templates (your step 5), I ran into a massive problem. With System/Reporting set to "Graphite Separate Instances", I edited influx.conf to read database = "truenas" and restarted Influxdb. Of course everything on my dashboard broke, reading "No Data" in every panel. Examining the setup for each panel, I found that every existing 'this-that-the_other' now also had a 'this.that.the_other' as well. Naturally, I selected the dot notation variation. Still, nothing worked. I reverted to the hyphonated variation. Nothing worked. I switched back to database = "grafana"; nothing worked. Finally, I undid the "Graphite Separate Instances" section and everything sprung into life again. So further experimenting, leaving "Graphite Separate Instances" set to Off, I changed the Influx.conf file back to database = "truenas". Everything broke. So - either of these 2 changes results in the Graphana display breaking, which is very curious I find.

I think I won't play with this again; following the 'if it aint broke don't fix it' maxim. (Note this is contrary to the maxim of a great many software engineers I have encountered, whose maxim appears to be "if it aint broke, fix it till it is" - but I digress!). Still, I'd be interested to have your thoughts on the behaviour I noticed here.

4.
Thank you for the 'use ssh' tip when it comes to copy/pasting. That will come in very useful for sure!

Regards

Frankie.
 

Patrick M. Hausen

Hall of Famer
Joined
Nov 25, 2013
Messages
7,776
I think you're saying tha the mention of database = "graphite" simply says 'use the data format convention that graphite uses'. Ok, that I understand, and I understand you saying that iX standardised on that format. Fine so far. So then, what does renaming database = "graphite" to database = "truenas" achieve? Surely they are, in effect, synonyms for the same data format? Further to that, you say "it needs a name" - but if the two are effectively synonymous, and given that it already has a name (grafana), what did changing it to 'truenas' change?
The [[graphite]] heading says "the next section defines a graphite plain text compatible input.
The database = "graphite" statement says that this input shall log into a database named "graphite".
The bind-address = ":2003" says that this input can be reached on port 2003.

You could define another section like this in the same influxd:
Code:
[[graphite]]
  enabled = true
  database = "graphite2"
  bind-address = ":2004"

So now you have a second database named "graphite2" that can be reached on port 2004 and uses the same protocol.

The "database =" things are names. The headers on top define what kind of input protocol and database this "thing" is. You can have as many as you like. So you can name the database "truenas" if that is all you use it for.

You note that collectd is probably the data collector here. To make my understanding muddier, there is a section immediately following the header that looks like this:
Code:
[[collectd]]
  # enabled = false
  # bind-address = ":25826"
  # database = "collectd"
  # retention-policy = ""
  #

So I am wondering why this is all commented out if the collectd function is active doing the data collection? Is it that we let collectd do the collecting but tell it (above) to actually store the notation in graphite/truenas format?

iX deliver TrueNAS with a builtin reporting function. And they decided to use the product collectd for that. They could have used Telegraf instead, but they picked collectd. They also greatly enhanced the FreeBSD port of collectd so we get disk temperatures and stuff that the standard port does not do.

That collectd runs on the TrueNAS host. They further decided that they hardcode into the collectd configuration that it should use the graphite plain text protocol instead of the native collectd protocol. For reasons. They do neither know nor care what you and I set up on the receiving end and if that is a jail on the same host, some central enterprise reporting system or whatever. If we use Graphite, InfluxDB, Prometheus, ... they send data in the graphite format. Period.

Login to your TrueNAS host and check /usr/local/etc/collectd.conf. That's what is collected and where it is sent.

The InfluxDB port in your jail on the other hand comes with a config file that defines examples of various input mechanisms all commented out. You or someone else uncommented and tuned the [[graphite]] section to define a graphite compatible input channel and database.

Despite thinking that changing my Grafana innards from the working setup I had to follow your steps, would result in breaking it, I decided to follow your advice anyway, partly as a learning exercise and partly to feel I was finally doing it 'the right way'. However, prior to getting as far as setting up the templates
[...]
Without the matching template Influx will not parse the "separate instances" output correctly. Second you need to change your data source in Grafana to use the new "truenas" database instead of the "graphite" database.

Sorry, no time tonight for further investigation or trying to reproduce your problems. Hope the above is of help, anyway.

Kind regards,
Patrick
 
Top