Jack828
Dabbler
- Joined
- Nov 11, 2020
- Messages
- 16
Hey folks!
Like some others on the forums, my dashboard's metrics graphs don't work, even on a first time install of v12! So, to satiate my need for data, I decided to use Grafana.
I've been setting up Grafana + InfluxDB on my TrueNAS 12 setup and have been struggling to find a start to finish guide on how to do it, including correctly parsing the Graphite metrics from the NAS.
I know the community plugin exists, but why use that when you can do it yourself?
This'll also serve as my local scratchpad for how I'm still setting it up, so, please excuse the rough state at the moment. I'm also hoping the fact that I can edit my OP to amend the information in there, but if not then I'll have to think of something else, and possibly re-post the guide in it's entirety after you lot give me some good feedback.
Without further ado, let's get started!
Fair warning, we'll be using both the GUI and command line, so this guide does assume you're able to SSH in (using key based auth, hopefully!) the rest of the steps will be very hand-holdy.
0. Preamble
In this post I'll be showing lots of code blocks. In those, the lines that start with
1. The Jail
We'll need somewhere for all our work to live. Instead of cluttering up the system for many jails for each service, I like to group logically similar processes together into one jail for ease of use.
Before we create it, we'll need to see what is the latest release we should be using:
We can see that the latest is
Once that's done, go ahead and log into the shell for it:
2. Processes
Now, let's setup our metrics processes. You'll need to install the
You can also take the opportunity to install your preferred editor of choice - I'll use
*note: grafana7 is the latest version at the time of writing this
Now enable and start the InfluxDB and Grafana services:
Let's verify our InfluxDB is working correctly, and also get our database ready for metrics.
Now we need to modify our InfluxDB config - it lives here:
I recommend having a good read of the file - you might find it does something else you like!
Anyway, for Graphite metrics, I'd recommend matching the config to the one shown below:
After editing that config file, you'll need to restart the service with
Now, we need to tell our TrueNAS where to dump it's metrics data. In the GUI, head to System -> Reporting, and add your grafana jail's IP address into

Hit save and head back to the jail command line. We're going to check to see if it's recording any metrics.
If you see all the series, great! Let's move on.
3. Grafana
Head to
Click
Set the URL to be


Smash

4. Templates
Now that this is done - if you're happy setting up multiple queries on long measurements then we're all done! Head to Grafana and setup the dashboard as you like!
However, we can utilise the powerful
Head back to the
So this is where it gets a little complicated to explain - you saw in InfluxDB when you ran
The series in InfluxDB is this is
This isn't necessarily a bad way of storing the metric - but you'll need a number of queries equal to the number of disks you have to show this is in Grafana! If you ever add more disks, you'll need to amend all your graphs to have the additional query.
So, let's fix this by filtering the series to only all the
In the
We want to group the metrics in the
So our filter is simple - all servers, all hosts, all and only disktemp -
Now, we can correct the template - ignore servers, tag the host, tag the measurement, tag the disk, and tag the field -
All together, our template for disk temperature aggregation becomes
And restart InfluxDB:
Wait a few moments for your NAS to report the disktemp metrics - mine takes 15-20s.
Let's now have a look in the database to see if it's correctly parsed our new metric:
You'll now see that all the disktemp metrics are aggregated into a single series - split up by the disk, with a field called temperature!
Head to Grafana now and create a new panel - below is the default query that Grafana shows you for your InfluxDB data source.

Note how we have an option in the
We also need to change the
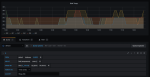
At this point, your graph will have roared into life, but it isn't showing each disk, just a mean of all the measurements.
So first off, we'll change the points to a continuous line by adjusting the
Now we'll change the
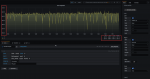
And as if by magic, you should (hopefully) see a graph containing a line for each disk's temperature.

You can see the legend has now changed from
Let's make it a little less noisy - in the
Your final graph and query should look like this:

Here's a couple more templates for you to try and figure out the correct graph query - don't worry, Grafana should give you hints when you're entering the data.
5. Fin
Here's the final templates config I have for Influx: [Work in Progress!]
Thanks for reading and I hope you've successfully setup a beautiful metrics dashboard. If I've misquoted, misunderstood, or been just plain wrong, please let me know!
6. Further Reading / Sources
 docs.influxdata.com
Like some others on the forums, my dashboard's metrics graphs don't work, even on a first time install of v12! So, to satiate my need for data, I decided to use Grafana.
I've been setting up Grafana + InfluxDB on my TrueNAS 12 setup and have been struggling to find a start to finish guide on how to do it, including correctly parsing the Graphite metrics from the NAS.
I know the community plugin exists, but why use that when you can do it yourself?
This'll also serve as my local scratchpad for how I'm still setting it up, so, please excuse the rough state at the moment. I'm also hoping the fact that I can edit my OP to amend the information in there, but if not then I'll have to think of something else, and possibly re-post the guide in it's entirety after you lot give me some good feedback.
Without further ado, let's get started!
Fair warning, we'll be using both the GUI and command line, so this guide does assume you're able to SSH in (using key based auth, hopefully!) the rest of the steps will be very hand-holdy.
0. Preamble
In this post I'll be showing lots of code blocks. In those, the lines that start with
moneta% are run on the TrueNAS, and root@grafana:/ # are run within the jail.1. The Jail
We'll need somewhere for all our work to live. Instead of cluttering up the system for many jails for each service, I like to group logically similar processes together into one jail for ease of use.
Before we create it, we'll need to see what is the latest release we should be using:
Code:
moneta% sudo iocage fetch
[0] 11.2-RELEASE (EOL)
[1] 11.3-RELEASE (EOL)
[2] 11.4-RELEASE
[3] 12.0-RELEASE (EOL)
[4] 12.1-RELEASE
[5] 12.2-RELEASE

Type the number of the desired RELEASE
Press [Enter] to fetch the default selection: (Not a RELEASE)
Type EXIT to quit: ^C
Aborted!
We can see that the latest is
12.2-RELEASE so our jail creation command will be:Code:
moneta% sudo iocage create -n grafana -r 12.2-RELEASE boot=on vnet=on allow_tun=1 ip4_addr="vnet0|192.168.0.100/24" allow_sysvipc=1 bpf=yes
Once that's done, go ahead and log into the shell for it:
Code:
moneta% jls
   JID  IP Address      Hostname                      Path
    18                  grafana                       /mnt/tank/iocage/jails/grafana/root
moneta% sudo jexec 18 tcsh
root@grafana:/ #
2. Processes
Now, let's setup our metrics processes. You'll need to install the
influxdb and grafana7* packages.You can also take the opportunity to install your preferred editor of choice - I'll use
nano, because it's more lightweight than importing my vim config.*note: grafana7 is the latest version at the time of writing this
Code:
root@grafana:/ # pkg install -y nano influxdb grafana7
Now enable and start the InfluxDB and Grafana services:
Code:
root@grafana:/ # sysrc influxd_enable="YES"
root@grafana:/ # sysrc grafana_enable="YES"
root@grafana:/ # service influxd start
root@grafana:/ # service grafana start
Let's verify our InfluxDB is working correctly, and also get our database ready for metrics.
Code:
root@grafana:/ # influx
Connected to http://localhost:8086 version 1.8.0
InfluxDB shell version: 1.8.0
> create database graphite
> show databases
name: databases
name
----
_internal
graphite
Now we need to modify our InfluxDB config - it lives here:
/usr/local/etc/influxd.conf. Open that file, and head to the [[graphite]] section.I recommend having a good read of the file - you might find it does something else you like!
Anyway, for Graphite metrics, I'd recommend matching the config to the one shown below:
Code:
###
### [[graphite]]
###
### Controls one or many listeners for Graphite data.
###

[[graphite]]
  # Determines whether the graphite endpoint is enabled.
  enabled = true
  database = "graphite"
  # retention-policy = ""
  bind-address = ":2003"
  protocol = "tcp"
  consistency-level = "one"

  # These next lines control how batching works. You should have this enabled
  # otherwise you could get dropped metrics or poor performance. Batching
  # will buffer points in memory if you have many coming in.

  # Flush if this many points get buffered
  batch-size = 5000

  # number of batches that may be pending in memory
  batch-pending = 10

  # Flush at least this often even if we haven't hit buffer limit
  batch-timeout = "1s"

  # UDP Read buffer size, 0 means OS default. UDP listener will fail if set above OS max.
  # udp-read-buffer = 0

  ### This string joins multiple matching 'measurement' values providing more control over the final measurement name.
  # separator = "."

  ### Default tags that will be added to all metrics.  These can be overridden at the template level
  ### or by tags extracted from metric
  # tags = ["region=us-east", "zone=1c"]

  ### Each template line requires a template pattern.  It can have an optional
  ### filter before the template and separated by spaces.  It can also have optional extra
  ### tags following the template.  Multiple tags should be separated by commas and no spaces
  ### similar to the line protocol format.  There can be only one default template.
  templates = [
    # Default template
    # "server.*",
  ]
After editing that config file, you'll need to restart the service with
service influxd restart for it to pick up the changes.Now, we need to tell our TrueNAS where to dump it's metrics data. In the GUI, head to System -> Reporting, and add your grafana jail's IP address into
Remote Graphite Server Hostname. Optionally, you can change it so it reports CPU usage in %.Hit save and head back to the jail command line. We're going to check to see if it's recording any metrics.
Code:
root@grafana:/ # influx
Connected to http://localhost:8086 version 1.8.0
InfluxDB shell version: 1.8.0
> use graphite
> show series
key
----
servers.moneta_local.aggregation.cpu-average.cpu.idle
servers.moneta_local.aggregation.cpu-average.cpu.interrupt
servers.moneta_local.aggregation.cpu-average.cpu.nice
servers.moneta_local.aggregation.cpu-average.cpu.system
...omitted for brevity...
If you see all the series, great! Let's move on.
3. Grafana
Head to
http://jail.ip.address:3000/datasources and let's setup Grafana.Click
Add data source and choose InfluxDB.Set the URL to be
http://localhost:8086 and your database to be graphite (as we set up earlier).Smash
Save & Test and you should see a beautiful green banner letting you know all is good.4. Templates
Now that this is done - if you're happy setting up multiple queries on long measurements then we're all done! Head to Grafana and setup the dashboard as you like!
However, we can utilise the powerful
templates feature of InfluxDB's Graphite parser to make this data a little more friendly.Head back to the
[[graphite]] section of the config /usr/local/etc/influxd.conf.So this is where it gets a little complicated to explain - you saw in InfluxDB when you ran
show series the huge number of different metrics being collected. We'll focus, for now, on the disktemp metrics series.The series in InfluxDB is this is
servers.moneta_local.disktemp.da0.temperature (in my case) with a value key holding the actual temperature (in Celsius), for my da0 disk.This isn't necessarily a bad way of storing the metric - but you'll need a number of queries equal to the number of disks you have to show this is in Grafana! If you ever add more disks, you'll need to amend all your graphs to have the additional query.
So, let's fix this by filtering the series to only all the
disktemp ones, and parse it into a single series. We want our resultant series to be filterable by each disk and have appropriately named fields.In the
templates option in the config, each line is made up of a filter, and then a template for aggregating the metric, and optional tags.We want to group the metrics in the
disktemp.* series together, and tag them to associate which disk is what.So our filter is simple - all servers, all hosts, all and only disktemp -
*.*.disktemp.*.Now, we can correct the template - ignore servers, tag the host, tag the measurement, tag the disk, and tag the field -
.host.measurement.disk.field.All together, our template for disk temperature aggregation becomes
"*.*.disktemp.* .host.measurement.disk.field". Chuck this into your config:Code:
[[graphite]]
...omitted for brevity...
  templates = [
    "*.*.disktemp.* .host.measurement.disk.field",
    # Default template
    # "server.*",
  ]
And restart InfluxDB:
Code:
root@grafana:/ # service influxd restart
Wait a few moments for your NAS to report the disktemp metrics - mine takes 15-20s.
Let's now have a look in the database to see if it's correctly parsed our new metric:
Code:
root@grafana:/ # influx
Connected to http://localhost:8086 version 1.8.0
InfluxDB shell version: 1.8.0
> use graphite
> select * from disktemp group by * order by desc limit 1
name: disktemp
tags: disk=da0, host=moneta_local
time                temperature
----                -----------
1606067385000000000 28

name: disktemp
tags: disk=da1, host=moneta_local
time                temperature
----                -----------
1606067385000000000 29
...omitted for brevity...
You'll now see that all the disktemp metrics are aggregated into a single series - split up by the disk, with a field called temperature!
Head to Grafana now and create a new panel - below is the default query that Grafana shows you for your InfluxDB data source.
Note how we have an option in the
FROM clause to select a measurement - we already set this in our template above using the measurement keyword - in our case, this is disktemp.We also need to change the
field selected in the SELECT clause to be the field we set in the template - in our case, this is temperature.At this point, your graph will have roared into life, but it isn't showing each disk, just a mean of all the measurements.
So first off, we'll change the points to a continuous line by adjusting the
GROUP BY's fill function to be linear.Now we'll change the
GROUP BY a little more to separate by the tag we added in our template - disk - you'll need to add tag(disk).And as if by magic, you should (hopefully) see a graph containing a line for each disk's temperature.
You can see the legend has now changed from
disktemp.mean to one for each tagged item in the series!Let's make it a little less noisy - in the
ALIAS BY clause of the query, tell Grafana to use the disk tag - $tag_disk.Your final graph and query should look like this:
Here's a couple more templates for you to try and figure out the correct graph query - don't worry, Grafana should give you hints when you're entering the data.
Code:
    "*.*.cputemp.* .host.measurement.cpu.field",
    "*.*.uptime.* .host.measurement.field",
    "*.*.load.* .host.measurement..term.field",
5. Fin
Here's the final templates config I have for Influx: [Work in Progress!]
Code:
  templates = [
    "*.*.cputemp.* .host.measurement.cpu.field",
    "*.*.uptime.* .host.measurement.field",
    "*.*.load.* .host.measurement..term.field",
    "*.if_octets.* .host.interface.measurement.field..",
    "*.if_packets.* .host.interface.measurement.field..",
    "*.if_errors.* .host.interface.measurement.field..",
  ]
Thanks for reading and I hope you've successfully setup a beautiful metrics dashboard. If I've misquoted, misunderstood, or been just plain wrong, please let me know!
6. Further Reading / Sources
Graphite protocol support in InfluxDB | InfluxDB OSS v1 Documentation
Use the Graphite plugin to write data to InfluxDB using the Graphite protocol.
Attachments
Last edited: