I have installed grafana and influxdb via
And both function absolutely fine. I can see
With both functioning fine in terms of what youd expect at this stage. I have set up a graphite DB on influx and put the reporting data to it via truenas and this all shows up with no issue.
The database attaches fine in grafana (9.5.7) and shows 863 items selected. I can explore these and see the timeseries data in the pool via this data source. It only works for a very short amount of time however before a network error comes up and grafana crashes.


When trying to add data to any visualization in the panels, it does not show ANY data whatsoever and it does the same freeze and crash.

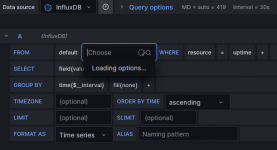
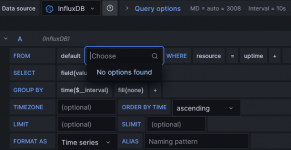
stuck on loading options followed by no options, then a crash.
Any ideas on what is going on or if any more information is required? Thanks in advance
Code:
pkg install www/grafana9
pkg install influxd
And both function absolutely fine. I can see
Code:
service grafana status
grafana is running as pid xyz
service influxd status
influxd is running as pid abc
With both functioning fine in terms of what youd expect at this stage. I have set up a graphite DB on influx and put the reporting data to it via truenas and this all shows up with no issue.
Code:
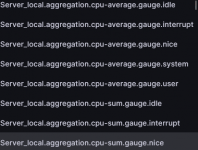
root@grafana:~ # influx
Connected to http://localhost:8086 version 1.8.10
InfluxDB shell version: 1.8.10
> use graphite
Using database graphite
> show series
key
---
servers.Server_local.aggregation.cpu-average.gauge.idle
servers.Server_local.aggregation.cpu-average.gauge.interrupt
servers.Server_local.aggregation.cpu-average.gauge.nice
servers.Server_local.aggregation.cpu-average.gauge.system
servers.Server_local.aggregation.cpu-average.gauge.user
servers.Server_local.aggregation.cpu-sum.gauge.idle
servers.Server_local.aggregation.cpu-sum.gauge.interrupt
servers.Server_local.aggregation.cpu-sum.gauge.nice
servers.Server_local.aggregation.cpu-sum.gauge.system
servers.Server_local.aggregation.cpu-sum.gauge.us61881
The database attaches fine in grafana (9.5.7) and shows 863 items selected. I can explore these and see the timeseries data in the pool via this data source. It only works for a very short amount of time however before a network error comes up and grafana crashes.
When trying to add data to any visualization in the panels, it does not show ANY data whatsoever and it does the same freeze and crash.
stuck on loading options followed by no options, then a crash.
Any ideas on what is going on or if any more information is required? Thanks in advance