SOLVED Help with truenas information in grafana/influxDB.

ragametal

Contributor
Joined
May 4, 2021
Messages
188
I don't know if my issues are related to Truenas and their implementation of Graphite, or if this is an InfluxDB or even Grafana but here it goes.

I’m trying to create a single Grafana dashboard with the most important metrics of the main devices in my network such as firewall and nas but i’m having a lot of problems with the metrics from Truenas.

Can any of you help me with any of the items below?

Used space in a pool is missing
the metrics for the "Free" space of the pools are available but not “Used” space.

The “used” space information would let me create things like a pie chart or a bar chart which are typical representations of space in disks and arrays.

I know there are some ways to calculate the used space of the pool by “adding” the “used space” of each of the data sets in that pool (ref https://www.youtube.com/watch?v=2jSwrok3tSY) and I tried that workaround but the information of one of my datasets is just not available. The dataset that is missing is the target for the local replication tasks which was automatically created by truenas when i set up that local replication.

I wouldn’t mind having to use this method but i just can’t. I mean, why would the information of some datasets be available and not the information of others? (forget that question, the “why” is irrelevant, solutions are the only thing that matters).

Can any of you help me with this?

UPS status is missing.
Several metrics about the UPS are available such as input/output frequency, input/output voltage, charge and load but the Status of the UPS is missing.

I would argue that the status is the most important parameter of the UPS because is the only one that allows you to take a corrective action (for example “RB” for replace battery or “OL” for On-Line).

Think about it, how good is it to know that you are having a frequency or a voltage problem if you cannot do anything to solve that problem? I mean, it is nice to know but in the practical sense it is useless to know.

“Services” memory is missing
I know this has been discussed in multiple posts before and that this information is just not available. So this is just a rant to vent my frustration since there is no known solution for getting this info from truenas to InfluxDB.

Network traffic information is inconsistent
I can plot the metrics about the network traffic just fine in grafana but the results are not consistent with what Truenas is reporting.

For instance, right now the mean received data per grafana is 1.80 Kb/s
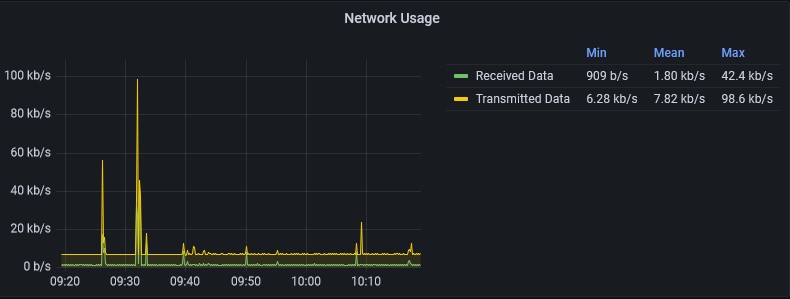
Network grafana.jpg


But truenas is saying 14.08Kb.
network truenas.jpg


Have any of you seen this behaviour? As a side note, my units are set to “bits/sec (SI)”.
 

ragametal

Contributor
Joined
May 4, 2021
Messages
188
How about if we split this into smaller problems?
Do anybody knows a way to expose the "Used" space of the pools to InfluxDB?
 
Joined
Jan 27, 2020
Messages
577
bump, it's about time reporting - be it grafana or netdata - gets more attention.
 

Patrick M. Hausen

Hall of Famer
Joined
Nov 25, 2013
Messages
7,776
Are you using the "reporting" function that is built in or a separate graphite installation? I use the former to push data into InfluxDB and visualize with Grafana. That's actually collectd running inside TN and using the graphite plain text API to deliver the data.

For pool space I have created this shell script that delivers all the data I need. The prefix is defined to match with what the built in collectd does.
Code:
root@freenas[/mnt/hdd/scripts]# cat zpool-metrics.sh
#! /bin/sh

HOST="192.168.1.55"
PORT="2003"
PREFIX="servers"

time=$(/bin/date +%s)
hostname=$(/bin/hostname | /usr/bin/tr '.' '_')

/usr/local/sbin/zpool list -Hp | while read pool size alloc free ignore
do
    ralloc=$(echo "scale=8;${alloc}/${size}" | /usr/bin/bc)   
    rfree=$(echo "scale=8;${free}/${size}" | /usr/bin/bc)   

    echo "${PREFIX}.${hostname}.zpool.${pool}.size ${size} ${time}"
    echo "${PREFIX}.${hostname}.zpool.${pool}.alloc ${alloc} ${time}"
    echo "${PREFIX}.${hostname}.zpool.${pool}.alloc-ratio ${ralloc} ${time}"
    echo "${PREFIX}.${hostname}.zpool.${pool}.free ${free} ${time}"
    echo "${PREFIX}.${hostname}.zpool.${pool}.free-ratio ${rfree} ${time}"
done | /usr/bin/nc "${HOST}" "${PORT}" -w2
 

ragametal

Contributor
Joined
May 4, 2021
Messages
188
@Patrick M. Hausen, I'm indeed using the built-in "reporting" function of truenas. I will give your script a try but, how do you run it?

What i mean is, do you run it via a Cron Job (if so, how often)? or as an Init script?
 

Patrick M. Hausen

Hall of Famer
Joined
Nov 25, 2013
Messages
7,776
It's a cron job. I run it every 15 minutes. Zpool usage rarely changes rapidly. You need to set the "HOST" parameter to the address of your InfluxDB.
 
Last edited:
Joined
Jan 27, 2020
Messages
577
Network traffic information is inconsistent
The way I see it, the interface traffic in collectd is reported in packets - not in kb/s. I couldn't find a way to report troughput in bits/byte with grafana.

“Services” memory is missing
Don't get me started. Even the Truenas gui is not consistent on memory reporting. Just for fun - compare htop memory usage with the gui memory usage. Completely unreliable.
 

Patrick M. Hausen

Hall of Famer
Joined
Nov 25, 2013
Messages
7,776
The way I see it, the interface traffic in collectd is reported in packets - not in kb/s. I couldn't find a way to report troughput in bits/byte with grafana.

1. Bytes are called "octets" in networking-land:
Code:
root@grafana:~ # echo "show series;" | influx -database graphite | grep freenas_ettlingen.\*lagg0
if_errors.rx,hostname=freenas_ettlingen_hausen_com,instance=lagg0,resource=interface
if_errors.tx,hostname=freenas_ettlingen_hausen_com,instance=lagg0,resource=interface
if_octets.rx,hostname=freenas_ettlingen_hausen_com,instance=lagg0,resource=interface
if_octets.tx,hostname=freenas_ettlingen_hausen_com,instance=lagg0,resource=interface
if_packets.rx,hostname=freenas_ettlingen_hausen_com,instance=lagg0,resource=interface
if_packets.tx,hostname=freenas_ettlingen_hausen_com,instance=lagg0,resource=interface

2. "Services memory" is not a live value the operating system is measuring and reporting but something arbitrary TrueNAS computes *somehow*. That's why it's missing in SNMP, collectd, etc.
 
Last edited:
Joined
Jan 27, 2020
Messages
577
Are you using the "reporting" function that is built in or a separate graphite installation? I use the former to push data into InfluxDB and visualize with Grafana. That's actually collectd running inside TN and using the graphite plain text API to deliver the data.

For pool space I have created this shell script that delivers all the data I need. The prefix is defined to match with what the built in collectd does.
Code:
root@freenas[/mnt/hdd/scripts]# cat zpool-metrics.sh
#! /bin/sh

HOST="192.168.1.55"
PORT="2003"
PREFIX="servers"

time=$(/bin/date +%s)
hostname=$(/bin/hostname | /usr/bin/tr '.' '_')

/usr/local/sbin/zpool list -Hp | while read pool size alloc free ignore
do
    ralloc=$(echo "scale=8;${alloc}/${size}" | /usr/bin/bc)  
    rfree=$(echo "scale=8;${free}/${size}" | /usr/bin/bc)  

    echo "${PREFIX}.${hostname}.zpool.${pool}.size ${size} ${time}"
    echo "${PREFIX}.${hostname}.zpool.${pool}.alloc ${alloc} ${time}"
    echo "${PREFIX}.${hostname}.zpool.${pool}.alloc-ratio ${ralloc} ${time}"
    echo "${PREFIX}.${hostname}.zpool.${pool}.free ${free} ${time}"
    echo "${PREFIX}.${hostname}.zpool.${pool}.free-ratio ${rfree} ${time}"
done | /usr/bin/nc "${HOST}" "${PORT}" -w2
"servers.*.mnt.df_complex.free" would be give me the same output, no?
 

Patrick M. Hausen

Hall of Famer
Joined
Nov 25, 2013
Messages
7,776
No. The df series give you the information per dataset which can be misleading, because the free space is reported identically for all datasets sharing a pool. Use df on the command line and you see what I mean. Collectd does not report the space per pool at all, hence my script. As you can see from the script it's completely trivial to throw data at Influx using the graphite plain text protocol - that's why I used that approach.

Edit: servers.*.mnt-<name_of_pool>.df_complex.free would indeed give you the free space in pool "name_of_pool" - I missed that "mnt" on my first answer. But there is no similar shortcut for the used space, because you don't keep data in the top level of your pool and "used" is not the recursive sum of all child datasets, anyway.
 
Joined
Jan 27, 2020
Messages
577
Thank you Patrick, for the detailed explanation.
 
Joined
Jan 27, 2020
Messages
577
No. The df series give you the information per dataset which can be misleading, because the free space is reported identically for all datasets sharing a pool. Use df on the command line and you see what I mean. Collectd does not report the space per pool at all, hence my script. As you can see from the script it's completely trivial to throw data at Influx using the graphite plain text protocol - that's why I used that approach.

Edit: servers.*.mnt-<name_of_pool>.df_complex.free would indeed give you the free space in pool "name_of_pool" - I missed that "mnt" on my first answer. But there is no similar shortcut for the used space, because you don't keep data in the top level of your pool and "used" is not the recursive sum of all child datasets, anyway.
At least for the top level of the pool, "used" would be "total space" subcontracted by "free space", wouldn't it? In grafana possible with a little bit of use of the math function.
 

Patrick M. Hausen

Hall of Famer
Joined
Nov 25, 2013
Messages
7,776
Mmmh ... from the top of my head, not at my desk atm - doesn't total shrink as other datasets eat into the available pool space?
 

ragametal

Contributor
Joined
May 4, 2021
Messages
188
At least for the top level of the pool, "used" would be "total space" subcontracted by "free space", wouldn't it? In grafana possible with a little bit of use of the math function.
I thought about this option too but, at least on my system, the field for the pool's "Total space" is not available in Grafana/InfluxDB either.

The way I see it, my only option is to use the script that @Patrick M. Hausen has provided. I just haven't had the time to test it yet.
 

Patrick M. Hausen

Hall of Famer
Joined
Nov 25, 2013
Messages
7,776
Yeah - the "df" metrics don't contain total capacity. Neither does the output of the df command. And computation does not work because of the ZFS intricacies. I know there was a reason why I wrote that script instead :smile:
 
Joined
Jan 27, 2020
Messages
577
I thought about this option too but, at least on my system, the field for the pool's "Total space" is not available in Grafana/InfluxDB either.

The way I see it, my only option is to use the script that @Patrick M. Hausen has provided. I just haven't had the time to test it yet.
Look again, depending on how much datasets reside in your pool, grafana does not display every option there is.
You can check with use graphite show series.
The name scheme is like that: servers.instance.mnt-<name_of_pool>-<name_of_dataset>.df_complex.free
The root dataset of your pool should also be there.
 

Patrick M. Hausen

Hall of Famer
Joined
Nov 25, 2013
Messages
7,776
The name scheme is like that: servers.instance.mnt-<name_of_pool>-<name_of_dataset>.df_complex.free
The root dataset of your pool should also be there.
Yes, but total space is not a part of these "df_complex" series. and it cannot be computed from used and free with ZFS ...
 
Joined
Jan 27, 2020
Messages
577
Yeah - the "df" metrics don't contain total capacity. Neither does the output of the df command. And computation does not work because of the ZFS intricacies. I know there was a reason why I wrote that script instead :smile:
I confirmed my calculation with a glimps in the gui. At least for the top level of my pool. The df.free shows exactly the free capacity of given pool in the webGUI > Pools. I know raw capacity of that pool, hence I can calculate the "used" metric. Sure, for individual datasets, that wouldn't work because free space of each dataset is free space of the whole pool - zfs logic.
 
Joined
Jan 27, 2020
Messages
577

Patrick M. Hausen

Hall of Famer
Joined
Nov 25, 2013
Messages
7,776
@ragametal asked about total space. I use it in Grafana to set an upper bound for the graph so I know whenever used + free exceeds total, the measurement is invalid.
 
Top