Disks performance in Scale Bluefin?

Daisuke

Contributor
Joined
Jun 23, 2011
Messages
1,041
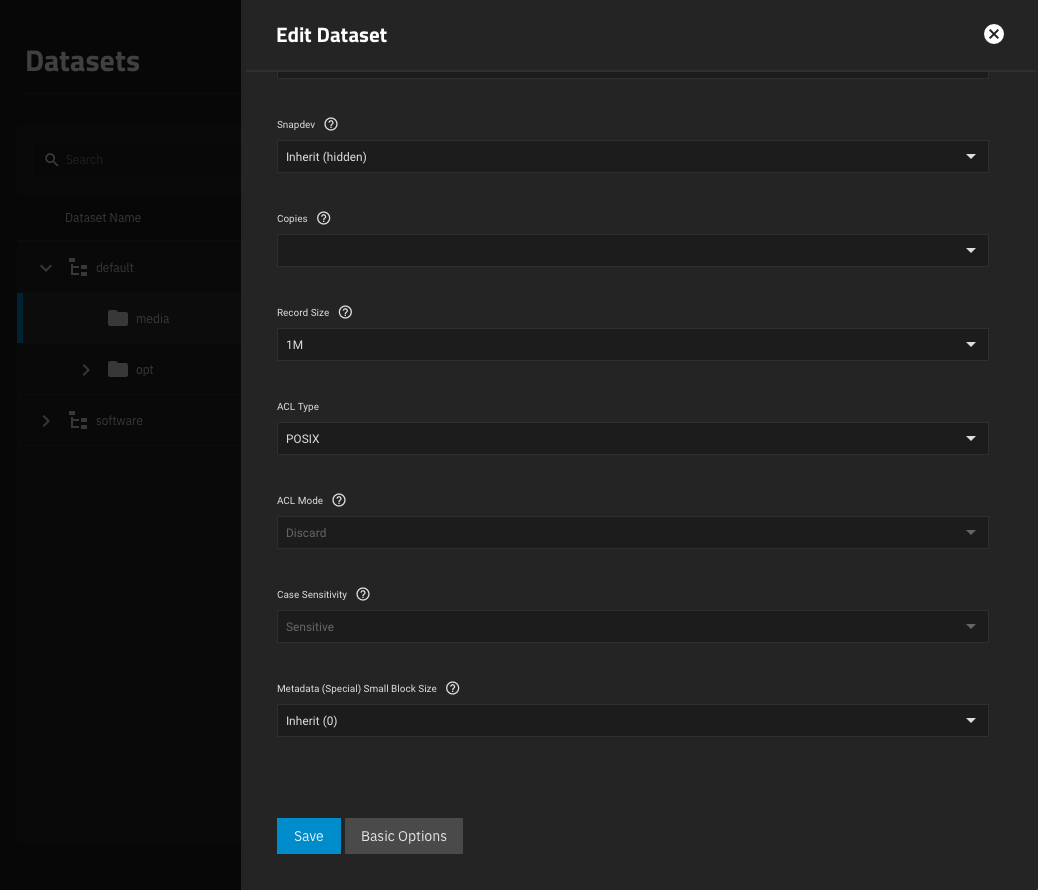
My goal is to move 20TB of data from /mnt/default/media dataset to /mnt/default/opt/media dataset. First thing I did is to change the /mnt/default/media dataset Record Size to 1M, from default 128K:
1671752724861.png


Based on my research, the general rule of recordsize is that it should closely match the typical workload experienced within that dataset. Since my media files average 5MB or more, should have recordsize=1M. This matches the typical I/O seen in that dataset, setting a larger recordsize prevents the files from becoming unduly fragmented, ensuring the fewest IOPS are consumed during either read or write of the data within that dataset.

12x HGST Ultrastar He8 Helium (HUH728080ALE601) 8TB CMR default pool:
Code:
# zpool status default
  pool: default
 state: ONLINE
  scan: resilvered 8.15M in 00:00:01 with 0 errors on Sat Dec 17 20:45:45 2022
config:

    NAME                                      STATE     READ WRITE CKSUM
    default                                   ONLINE       0     0     0
      raidz2-0                                ONLINE       0     0     0
        b768e9a0-820f-47cb-95f1-0a205dbe69a2  ONLINE       0     0     0
        11c649c6-15fb-4e4d-bb9e-a6e49d92dbe4  ONLINE       0     0     0
        66f8cece-5550-4032-abdf-2c62f5c193f4  ONLINE       0     0     0
        576baa03-374f-435e-906a-1b897df113dc  ONLINE       0     0     0
        6b6ae667-ae27-46e1-b059-3ba6f5ca4c5c  ONLINE       0     0     0
        eed80073-49af-40d5-842c-5b6b607ce36c  ONLINE       0     0     0
        de70ed0b-3d3b-43c8-a5ec-c536dba8cea7  ONLINE       0     0     0
        e77f0ce2-b5d1-4b5e-af46-237519b4495b  ONLINE       0     0     0
        7aa22586-b4b5-4326-86e5-dd0e14415627  ONLINE       0     0     0
        03dfccd5-8388-43c0-90d6-481b53f73a4e  ONLINE       0     0     0
        0e89244d-6504-411b-82ee-32ace0ed0359  ONLINE       0     0     0
        17700665-232a-48c1-a99e-82bdc5e26c14  ONLINE       0     0     0

errors: No known data errors

With Record Size set on /mnt/default dataset to 128K, I get a low write speed:
Code:
# pwd
/mnt/default

# fio --name=random-write --ioengine=posixaio --rw=randwrite --bs=4k \
  --numjobs=1 --size=4g --iodepth=1 --runtime=60 --time_based --end_fsync=1
Run status group 0 (all jobs):
  WRITE: bw=78.4MiB/s (82.2MB/s), 78.4MiB/s-78.4MiB/s (82.2MB/s-82.2MB/s), io=4886MiB (5123MB), run=62329-62329msec

With Record Size set on /mnt/default dataset to 1M, after reboot I get a significantly lower write speed:
Code:
# pwd
/mnt/default

# fio --name=random-write --ioengine=posixaio --rw=randwrite --bs=4k \
  --numjobs=1 --size=4g --iodepth=1 --runtime=60 --time_based --end_fsync=1
Run status group 0 (all jobs):
  WRITE: bw=1988KiB/s (2036kB/s), 1988KiB/s-1988KiB/s (2036kB/s-2036kB/s), io=117MiB (122MB), run=60042-60042msec

Server specs, hyper-threading disabled:
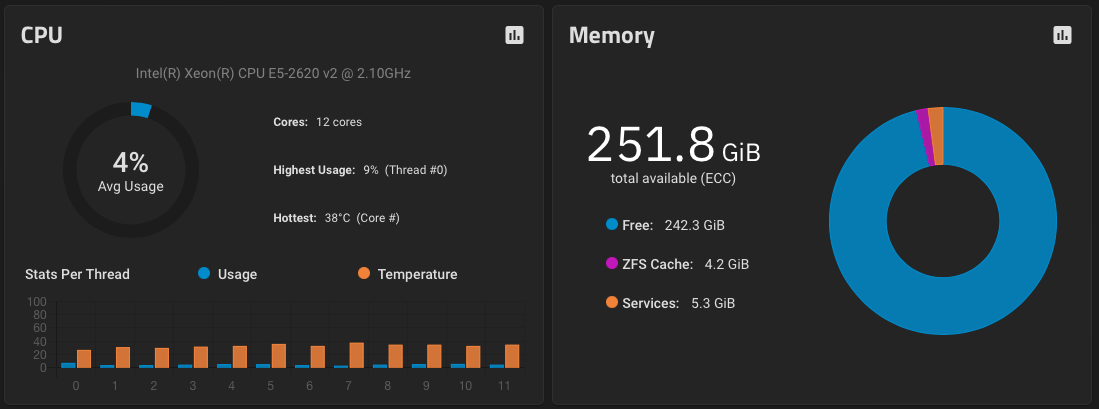
  • Dell R720xd with 12x HGST Ultrastar He8 Helium (HUH728080ALE601) 8TB for default pool expandability
  • 2x E5-2620 v2 @ 2.10GHz CPU
  • 16x 16GB 2Rx4 PC3-12800R DDR3-1600 ECC, for a total of 256GB RAM
  • 1x PERC H710 Mini, flashed to LSI 9207i firmware
  • 1x PERC H810 PCIe, flashed to LSI 9207e firmware
  • 1x NVIDIA Tesla P4 GPU, for transcoding
  • 2x Samsung 870 EVO 500GB SATA SSD for software pool hosting Kubernetes applications

1671641196302.png


Is there a warmup period after reboot, or do I need to change any other settings to improve the disks performance?
 
Last edited:

morganL

Captain Morgan
Administrator
Moderator
iXsystems
Joined
Mar 10, 2018
Messages
2,694
How are you "moving" the data? (its really a copy function)
 

Daisuke

Contributor
Joined
Jun 23, 2011
Messages
1,041
Your fio command is testing single-worker 4K random writes
I’m not familiar with fio, can you please recommend a proper command format? I used a different command, let me know if I should change anything.

zfs_arc_max and arcstats output, arc_summary is useful also for more detailed information:
Code:
# cat /sys/module/zfs/parameters/zfs_arc_max
0

# arcstat -pf size | grep -v size
73702483648

# cat /proc/spl/kstat/zfs/arcstats
12 1 0x01 123 33456 16774243284 106138389184768
name                            type data
hits                            4    759814550
misses                          4    151090893
demand_data_hits                4    167426913
demand_data_misses              4    734174
demand_metadata_hits            4    592305271
demand_metadata_misses          4    915654
prefetch_data_hits              4    18978
prefetch_data_misses            4    149259478
prefetch_metadata_hits          4    63388
prefetch_metadata_misses        4    181587
mru_hits                        4    162106101
mru_ghost_hits                  4    266660
mfu_hits                        4    597683594
mfu_ghost_hits                  4    1008245
deleted                         4    179183832
mutex_miss                      4    57585
access_skip                     4    24
evict_skip                      4    2342
evict_not_enough                4    449
evict_l2_cached                 4    0
evict_l2_eligible               4    33595169395712
evict_l2_eligible_mfu           4    17237782369792
evict_l2_eligible_mru           4    16357387025920
evict_l2_ineligible             4    34434953177088
evict_l2_skip                   4    0
hash_elements                   4    131544
hash_elements_max               4    1616252
hash_collisions                 4    6469478
hash_chains                     4    264
hash_chain_max                  4    4
p                               4    126694514432
c                               4    135201386496
c_min                           4    8450086656
c_max                           4    135201386496
size                            4    73677016032
compressed_size                 4    70926458368
uncompressed_size               4    71294714880
overhead_size                   4    2524063232
hdr_size                        4    43016640
data_size                       4    73187088384
metadata_size                   4    263433216
dbuf_size                       4    37737600
dnode_size                      4    117560928
bonus_size                      4    28098880
anon_size                       4    1676800
anon_evictable_data             4    0
anon_evictable_metadata         4    0
mru_size                        4    73316308480
mru_evictable_data              4    68713291776
mru_evictable_metadata          4    4900352
mru_ghost_size                  4    7204981248
mru_ghost_evictable_data        4    2798649344
mru_ghost_evictable_metadata    4    4406331904
mfu_size                        4    132536320
mfu_evictable_data              4    77824
mfu_evictable_metadata          4    131584
mfu_ghost_size                  4    969334784
mfu_ghost_evictable_data        4    262144
mfu_ghost_evictable_metadata    4    969072640
l2_hits                         4    0
l2_misses                       4    0
l2_prefetch_asize               4    0
l2_mru_asize                    4    0
l2_mfu_asize                    4    0
l2_bufc_data_asize              4    0
l2_bufc_metadata_asize          4    0
l2_feeds                        4    0
l2_rw_clash                     4    0
l2_read_bytes                   4    0
l2_write_bytes                  4    0
l2_writes_sent                  4    0
l2_writes_done                  4    0
l2_writes_error                 4    0
l2_writes_lock_retry            4    0
l2_evict_lock_retry             4    0
l2_evict_reading                4    0
l2_evict_l1cached               4    0
l2_free_on_write                4    0
l2_abort_lowmem                 4    0
l2_cksum_bad                    4    0
l2_io_error                     4    0
l2_size                         4    0
l2_asize                        4    0
l2_hdr_size                     4    0
l2_log_blk_writes               4    0
l2_log_blk_avg_asize            4    0
l2_log_blk_asize                4    0
l2_log_blk_count                4    0
l2_data_to_meta_ratio           4    0
l2_rebuild_success              4    0
l2_rebuild_unsupported          4    0
l2_rebuild_io_errors            4    0
l2_rebuild_dh_errors            4    0
l2_rebuild_cksum_lb_errors      4    0
l2_rebuild_lowmem               4    0
l2_rebuild_size                 4    0
l2_rebuild_asize                4    0
l2_rebuild_bufs                 4    0
l2_rebuild_bufs_precached       4    0
l2_rebuild_log_blks             4    0
memory_throttle_count           4    0
memory_direct_count             4    0
memory_indirect_count           4    0
memory_all_bytes                4    270402772992
memory_free_bytes               4    186751160320
memory_available_bytes          3    177801873664
arc_no_grow                     4    0
arc_tempreserve                 4    0
arc_loaned_bytes                4    0
arc_prune                       4    0
arc_meta_used                   4    489847264
arc_meta_limit                  4    101401039872
arc_dnode_limit                 4    10140103987
arc_meta_max                    4    1816040304
arc_meta_min                    4    16777216
async_upgrade_sync              4    1325205
demand_hit_predictive_prefetch  4    148707220
demand_hit_prescient_prefetch   4    18485
arc_need_free                   4    0
arc_sys_free                    4    8949286656
arc_raw_size                    4    0
cached_only_in_progress         4    0
abd_chunk_waste_size            4    80384

I'm thinking to apply the suggestions found in this thread, adapted for Linux. Get the I/O block size with fdisk, needed for --bsrange:
Code:
# fdisk -l /dev/sda
Disk /dev/sda: 7.28 TiB, 8001563222016 bytes, 15628053168 sectors
Disk model: HUH728080ALE601
Units: sectors of 1 * 512 = 512 bytes
Sector size (logical/physical): 512 bytes / 4096 bytes
I/O size (minimum/optimal): 4096 bytes / 4096 bytes
Disklabel type: gpt
Disk identifier: ECB5453C-6C46-45E0-86CC-E0E859EA5CA5

Device       Start         End     Sectors  Size Type
/dev/sda1      128     4194304     4194177    2G Linux swap
/dev/sda2  4194432 15628053134 15623858703  7.3T Solaris /usr & Apple ZFS

5min sequential reads, default pool:
Code:
# pwd
/mnt/default
# jobs=$(nproc)
# filesize=$(($(arcstat -pf size | grep -v size) * 2 / 1024 / 1024 / $jobs))
# fio --name=seq-read --ioengine=posixaio --iodepth=32 --rw=read \
  --invalidate=1 --bsrange=4k-4k --size=4g --runtime=300 --time_based \
  --filesize=${filesize}m --blocksize=1m --direct=1 --numjobs=$jobs
Run status group 0 (all jobs):
   READ: bw=4522MiB/s (4742MB/s), 366MiB/s-390MiB/s (383MB/s-409MB/s), io=1325GiB (1423GB), run=300001-300002msec
# rm -f seq-read.*

5min sequential writes:
Code:
# fio --name=seq-write --ioengine=posixaio --iodepth=32 --rw=write \
  --invalidate=1 --bsrange=4k-4k --size=4g --runtime=300 --time_based \
  --filesize=${filesize}m --blocksize=1m --direct=1 --numjobs=$jobs
Run status group 0 (all jobs):
  WRITE: bw=1070MiB/s (1121MB/s), 86.5MiB/s-91.3MiB/s (90.7MB/s-95.7MB/s), io=313GiB (336GB), run=300001-300003msec
# rm -f seq-write.*

5min sequential read-writes, curious why the results are identical:
Code:
# fio --name=seq-readwrite --ioengine=posixaio --iodepth=32 --rw=readwrite \
  --invalidate=1 --bsrange=4k-4k --runtime=300 --time_based \
  --filesize=${filesize}m --blocksize=1m --direct=1 --numjobs=$jobs
Run status group 0 (all jobs):
   READ: bw=1193MiB/s (1251MB/s), 96.2MiB/s-101MiB/s (101MB/s-106MB/s), io=349GiB (375GB), run=300001-300002msec
  WRITE: bw=1193MiB/s (1251MB/s), 96.1MiB/s-101MiB/s (101MB/s-106MB/s), io=349GiB (375GB), run=300001-300002msec
# rm -f seq-readwrite.*

5min random reads:
Code:
# fio --name=rand-read --ioengine=posixaio --iodepth=32 --rw=randread \
  --invalidate=1 --bsrange=4k-4k --runtime=300 --time_based \
  --filesize=${filesize}m --blocksize=1m --direct=1 --numjobs=$jobs
Run status group 0 (all jobs):
   READ: bw=1826MiB/s (1915MB/s), 48.6MiB/s-264MiB/s (50.0MB/s-277MB/s), io=535GiB (575GB), run=300001-300009msec
# rm -f rand-read.*

5min random writes, dramatic performance decrease:
Code:
# fio --name=rand-write --ioengine=posixaio --iodepth=32 --rw=randwrite \
  --invalidate=1 --bsrange=4k-4k --runtime=300 --time_based \
  --filesize=${filesize}m --blocksize=1m --direct=1 --numjobs=$jobs
Run status group 0 (all jobs):
  WRITE: bw=13.8MiB/s (14.4MB/s), 1112KiB/s-1224KiB/s (1139kB/s-1253kB/s), io=4130MiB (4330MB), run=300064-300120msec
# rm -f rand-write.*

5min random read-writes, worst performance:
Code:
# fio --name=rand-readwrite --ioengine=posixaio --iodepth=32 --rw=randrw \
  --invalidate=1 --bsrange=4k-4k --runtime=300 --time_based \
  --filesize=${filesize}m --blocksize=1m --direct=1 --numjobs=$jobs
Run status group 0 (all jobs):
   READ: bw=7092KiB/s (7263kB/s), 583KiB/s-601KiB/s (597kB/s-616kB/s), io=2079MiB (2180MB), run=300060-300120msec
  WRITE: bw=7081KiB/s (7251kB/s), 586KiB/s-597KiB/s (600kB/s-611kB/s), io=2075MiB (2176MB), run=300060-300120msec
# rm -f rand-readwrite.*

Can someone explain the big result differences? @sretalla mentions in this post to prepare a random file, I'll have to research on that, this is new to me. If anyone can provide additional guidance, it will be appreciated.
 
Last edited:

Daisuke

Contributor
Joined
Jun 23, 2011
Messages
1,041
How are you "moving" the data? (its really a copy function)
From terminal:
Code:
mv -f /mnt/default/media/* /mnt/default/opt/media/

I’m aware moving is slower than copying, my goal is to determine how to improve the disks performance into my Dell server. Based on research, fio is the recommended testing tool, but I cannot find any Scale documentation related to testing and improving the disks performance.
 
Last edited:

morganL

Captain Morgan
Administrator
Moderator
iXsystems
Joined
Mar 10, 2018
Messages
2,694
From terminal:
Code:
mv -f /mnt/default/media/* /mnt/default/opt/media/

I’m aware moving is slower than copying, my goal is to determine how to improve the disks performance into my Dell server. Based on research, fio is the recommended testing tool, but I cannot find any Scale documentation related to testing and improving the disks performance.

Terminology.. disk performance can't be changed, pool performance can be improved.

mv is probable very serial.... read block write block read block..... this process is latency sensitive.
SLOG or sync =never help.

The sequential read performance of 4522MB/s looks pretty good.
 

Davvo

MVP
Joined
Jul 12, 2022
Messages
3,222

Daisuke

Contributor
Joined
Jun 23, 2011
Messages
1,041
pool performance can be improved
Where can I find some documentation or guidelines? I'm currently looking at openzfs performance tuning.
The sequential read performance of 4522MB/s looks pretty good.
Should I open a Jira ticket for documentation improvements? There are no guidelines how to optimize the pool performance, which IMO is quite important.

I also opened a similar ticket for zpool upgrade recommended guidelines, but it was moved to a different Jira and now I cannot access it anymore.
Timothy Moore II mentioned you on an issue https://ixsystems.atlassian.net/browse/NAS-119514

Thanks for the feedback! I’m going to move this request to the documentation project tracker for investigation and resolution.
 
Last edited:

morganL

Captain Morgan
Administrator
Moderator
iXsystems
Joined
Mar 10, 2018
Messages
2,694
Where can I find some documentation of guidelines? I'm currently looking at OpenZFS tuning.

Should I open a Jira ticket for documentation improvements? There are no guidelines how to optimize the disks performance into datasets, which IMO is quite important.

I also opened a similar ticket for zpool upgrade recommended guidelines, but it was moved to a different Jira and now I cannot access it anymore.

This ZFS blog is generally applicable. https://www.truenas.com/blog/zfs-pool-performance-1/
 

Daisuke

Contributor
Joined
Jun 23, 2011
Messages
1,041
I understand but nowhere in that blog recordsize or any zfs optimizations are detailed? When you say sequential read performance of 4522MB/s looks pretty good is based on what standards? I started the files move process and this is my current iostat:
Code:
# zpool iostat default
              capacity     operations     bandwidth
pool        alloc   free   read  write   read  write
----------  -----  -----  -----  -----  -----  -----
default     20.0T  67.3T  1.13K    497   140M   170M

Why is the bandwidth so low?
 
Last edited:

morganL

Captain Morgan
Administrator
Moderator
iXsystems
Joined
Mar 10, 2018
Messages
2,694
I understand but nowhere in that blog recordsize or any zfs optimizations are detailed? When you say sequential read performance of 4522MB/s looks pretty good is based on what standards? I started the files move process and this is my current iostat:
Code:
# zpool iostat default
              capacity     operations     bandwidth
pool        alloc   free   read  write   read  write
----------  -----  -----  -----  -----  -----  -----
default     20.0T  67.3T  1.13K    497   140M   170M

Why is the bandwidth so low?

You reported:

Code:
# pwd
/mnt/default
# jobs=$(nproc)
# filesize=$(($(arcstat -pf size | grep -v size) * 2 / 1024 / 1024 / $jobs))
# fio --name=seq-read --ioengine=posixaio --iodepth=32 --rw=read \
--invalidate=1 --bsrange=4k-4k --size=4g --runtime=300 --time_based \
--filesize=${filesize}m --blocksize=1m --direct=1 --numjobs=$jobs
Run status group 0 (all jobs):
READ: bw=4522MiB/s (4742MB/s), 366MiB/s-390MiB/s (383MB/s-409MB/s), io=1325GiB (1423GB), run=300001-300002msec
# rm -f seq-read.*


Its likely not a ZFS or pool issue.... its an mv issue.

ZFS is parallel and multi-threaded (likes a large queue depth) , but mv is serial and single threaded.

"mv is probable very serial.... read block write block read block..... this process is latency sensitive.
SLOG or sync =never help."

If you ran multiple mv jobs in parallel.. you would get more bandwidth.. There is a whole business in copy software that is more parallel.
 

morganL

Captain Morgan
Administrator
Moderator
iXsystems
Joined
Mar 10, 2018
Messages
2,694
That’s fine @morganL, my goal is make sure my datasets are properly optimized. I did a lot of research and settings are very specific for each use of dataset.

Dataset recordsize is very dependent on the workloads.. smaller is good for small transactions (IOPS), larger is good for bandwidth.
 
Top