
NickF
Guru
- Joined
- Jun 12, 2014
- Messages
- 763
Hi all,
With SMB Clustering being out for about a year now, and with the first minor updates to Bluefin (22.12.1) and TrueCommand (2.3.1), both documenting improvements in this area, I've decided now is a good time to start playing around with clustering. I switched to SCALE in 2021 and I am putting my money where my mouth is.
I've put together a cluster of 3 small "TinyMinyMicro" nodes, each with 16GB of RAM and 2x512GB NVME drives (computer chosen has 2 PCIe Gen4x4 NVME slots) to do this testing. I think this can represent a pretty good "worst case scenario" for what people might try to do to stretch relatively low end gear. If CORE is scale UP with tons of disks in disk shelves, SCALE is scale out with multiple computers. Folks are undoubtedly going to try and do this on the cheap, and the TinyMiniMicro formfactor is, I think, the perfect low end starting point for understanding what performance might be. I have done testing with the onboard gigabit ethernet, as well as with a 5 Gigabit Ethernet USB adapter, connected to a multigigabit capable switch.
Anyway, for refrerence here is the SMB performance between my desktop (10 gigabit ethernet) and my "Production" homelab server (40 Gigabit Ethernet). I am using CrystalDiskMark just so that I have a reasonable baseline for comparing with other things, as the entire point of this exercise in futility is for me to understand the relative performance of things and share my findings.

FIO looks like this:
Performance of my local Gen 3 U.2 NVME drives on my desktop is as follows:

FIO Looks like this:
Now, with those REFERENCE points out of the way, here are my test results using gigabit ethernet on my SCALE cluster:

For some reason I lost the text output of FIO for this test, but heres a screen shot:

The same test at 5G (remember this is USB, so I think you can expect 2.5Gig PCIE cards to perform about the same)

and FIO at 5G:
I was going to test the relative performance of a SINGLE one of my test nodes, but it's getting late and TrueCommand/SCALE may be feature incomplete in that I can't seem to decom the cluster and go back to running a single node. This is still listed as experimental, so it's fine. I'll just wipe one of the test nodes and I'll update this thread with those results when I have some time.

I hope this helps some folks...and I hope I didn't perturb too many people by going off the beaten path and using a USB NIC @jgreco is probably screaming inside right now. In any case, my wife is going to have to deal with the electric bill from my big boy server a bit longer before moving to the hyperconverged and highly available SCALE cluster is ready for prime time.
With SMB Clustering being out for about a year now, and with the first minor updates to Bluefin (22.12.1) and TrueCommand (2.3.1), both documenting improvements in this area, I've decided now is a good time to start playing around with clustering. I switched to SCALE in 2021 and I am putting my money where my mouth is.
I've put together a cluster of 3 small "TinyMinyMicro" nodes, each with 16GB of RAM and 2x512GB NVME drives (computer chosen has 2 PCIe Gen4x4 NVME slots) to do this testing. I think this can represent a pretty good "worst case scenario" for what people might try to do to stretch relatively low end gear. If CORE is scale UP with tons of disks in disk shelves, SCALE is scale out with multiple computers. Folks are undoubtedly going to try and do this on the cheap, and the TinyMiniMicro formfactor is, I think, the perfect low end starting point for understanding what performance might be. I have done testing with the onboard gigabit ethernet, as well as with a 5 Gigabit Ethernet USB adapter, connected to a multigigabit capable switch.
Anyway, for refrerence here is the SMB performance between my desktop (10 gigabit ethernet) and my "Production" homelab server (40 Gigabit Ethernet). I am using CrystalDiskMark just so that I have a reasonable baseline for comparing with other things, as the entire point of this exercise in futility is for me to understand the relative performance of things and share my findings.
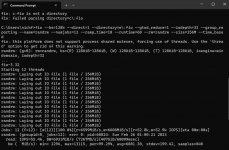
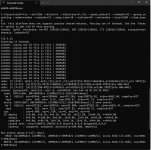
FIO looks like this:
Code:
C:\Users\nickf>fio --bs=128k --direct=1 --directory=z\:fio --gtod_reduce=1 --iodepth=32 --group_reporting --name=randrw --numjobs=12 --ramp_time=10 --runtime=60 --rw=randrw --size=256M --time_based
fio: this platform does not support process shared mutexes, forcing use of threads. Use the 'thread' option to get rid of this warning.
randrw: (g=0): rw=randrw, bs=(R) 128KiB-128KiB, (W) 128KiB-128KiB, (T) 128KiB-128KiB, ioengine=windowsaio, iodepth=32
...
fio-3.32
Starting 12 threads
randrw: Laying out IO file (1 file / 256MiB)
randrw: Laying out IO file (1 file / 256MiB)
randrw: Laying out IO file (1 file / 256MiB)
randrw: Laying out IO file (1 file / 256MiB)
randrw: Laying out IO file (1 file / 256MiB)
randrw: Laying out IO file (1 file / 256MiB)
randrw: Laying out IO file (1 file / 256MiB)
randrw: Laying out IO file (1 file / 256MiB)
randrw: Laying out IO file (1 file / 256MiB)
randrw: Laying out IO file (1 file / 256MiB)
randrw: Laying out IO file (1 file / 256MiB)
randrw: Laying out IO file (1 file / 256MiB)
Jobs: 12 (f=9): [m(1),/(1),m(4),/(1),m(1),/(1),m(3)][15.5%][r=166KiB/s,w=142KiB/s][r=1,w=1 IOPS][eJobs: 12 (f=12): [m(12)][16.9%][r=196MiB/s,w=205MiB/s][r=1565,w=1638 IOPS][eta 00m:59s]
Jobs: 12 (f=12): [m(12)][100.0%][r=153MiB/s,w=151MiB/s][r=1220,w=1206 IOPS][eta 00m:00s]
randrw: (groupid=0, jobs=12): err= 0: pid=58196: Sun Feb 26 01:07:30 2023
  read: IOPS=1664, BW=208MiB/s (218MB/s)(12.3GiB/60413msec)
   bw (  KiB/s): min=82446, max=399460, per=93.26%, avg=198726.02, stdev=6562.68, samples=627
   iops        : min=  640, max= 3115, avg=1549.01, stdev=51.19, samples=627
  write: IOPS=1667, BW=209MiB/s (219MB/s)(12.3GiB/60413msec); 0 zone resets
   bw (  KiB/s): min=107162, max=398916, per=92.08%, avg=197283.26, stdev=6451.41, samples=627
   iops        : min=  832, max= 3111, avg=1537.82, stdev=50.32, samples=627
  cpu          : usr=0.00%, sys=1.52%, ctx=0, majf=0, minf=0
  IO depths    : 1=0.0%, 2=0.1%, 4=0.1%, 8=0.2%, 16=13.5%, 32=86.3%, >=64=0.0%
     submit    : 0=0.0%, 4=100.0%, 8=0.0%, 16=0.0%, 32=0.0%, 64=0.0%, >=64=0.0%
     complete  : 0=0.0%, 4=99.5%, 8=0.3%, 16=0.1%, 32=0.1%, 64=0.0%, >=64=0.0%
     issued rwts: total=100571,100752,0,0 short=0,0,0,0 dropped=0,0,0,0
     latency   : target=0, window=0, percentile=100.00%, depth=32

Run status group 0 (all jobs):
   READ: bw=208MiB/s (218MB/s), 208MiB/s-208MiB/s (218MB/s-218MB/s), io=12.3GiB (13.2GB), run=60413-60413msec
  WRITE: bw=209MiB/s (219MB/s), 209MiB/s-209MiB/s (219MB/s-219MB/s), io=12.3GiB (13.3GB), run=60413-60413msec

C:\Users\nickf>
Performance of my local Gen 3 U.2 NVME drives on my desktop is as follows:
FIO Looks like this:
Code:
C:\Users\nickf>fio --bs=128k --direct=1 --directory=e\:fio --gtod_reduce=1 --iodepth=32 --group_reporting --name=randrw --numjobs=12 --ramp_time=10 --runtime=60 --rw=randrw --size=256M --time_based
fio: this platform does not support process shared mutexes, forcing use of threads. Use the 'thread' option to get rid of this warning.
randrw: (g=0): rw=randrw, bs=(R) 128KiB-128KiB, (W) 128KiB-128KiB, (T) 128KiB-128KiB, ioengine=windowsaio, iodepth=32
...
fio-3.32
Starting 12 threads
randrw: Laying out IO file (1 file / 256MiB)
randrw: Laying out IO file (1 file / 256MiB)
randrw: Laying out IO file (1 file / 256MiB)
randrw: Laying out IO file (1 file / 256MiB)
randrw: Laying out IO file (1 file / 256MiB)
randrw: Laying out IO file (1 file / 256MiB)
randrw: Laying out IO file (1 file / 256MiB)
randrw: Laying out IO file (1 file / 256MiB)
randrw: Laying out IO file (1 file / 256MiB)
randrw: Laying out IO file (1 file / 256MiB)
randrw: Laying out IO file (1 file / 256MiB)
randrw: Laying out IO file (1 file / 256MiB)
Jobs: 12 (f=12): [m(12)][100.0%][r=6599MiB/s,w=6608MiB/s][r=52.8k,w=52.9k IOPS][eta 00m:00s]
randrw: (groupid=0, jobs=12): err= 0: pid=60024: Sun Feb 26 01:00:21 2023
  read: IOPS=55.4k, BW=6931MiB/s (7267MB/s)(407GiB/60099msec)
   bw (  MiB/s): min= 2294, max=13115, per=99.29%, avg=6881.30, stdev=199.42, samples=840
   iops        : min=18355, max=104920, avg=55047.36, stdev=1595.38, samples=840
  write: IOPS=55.5k, BW=6938MiB/s (7275MB/s)(407GiB/60099msec); 0 zone resets
   bw (  MiB/s): min= 2394, max=13213, per=99.25%, avg=6885.77, stdev=199.50, samples=840
   iops        : min=19152, max=105703, avg=55083.20, stdev=1596.03, samples=840
  cpu          : usr=3.33%, sys=14.71%, ctx=0, majf=0, minf=0
  IO depths    : 1=0.2%, 2=0.6%, 4=2.9%, 8=10.3%, 16=58.5%, 32=27.6%, >=64=0.0%
     submit    : 0=0.0%, 4=100.0%, 8=0.0%, 16=0.0%, 32=0.0%, 64=0.0%, >=64=0.0%
     complete  : 0=0.0%, 4=96.8%, 8=1.3%, 16=0.7%, 32=1.2%, 64=0.0%, >=64=0.0%
     issued rwts: total=3332003,3335414,0,0 short=0,0,0,0 dropped=0,0,0,0
     latency   : target=0, window=0, percentile=100.00%, depth=32

Run status group 0 (all jobs):
   READ: bw=6931MiB/s (7267MB/s), 4096MiB/s-6931MiB/s (4295MB/s-7267MB/s), io=407GiB (437GB), run=60099-60099msec
  WRITE: bw=6938MiB/s (7275MB/s), 4096MiB/s-6938MiB/s (4295MB/s-7275MB/s), io=407GiB (437GB), run=60099-60099msec

C:\Users\nickf>
Now, with those REFERENCE points out of the way, here are my test results using gigabit ethernet on my SCALE cluster:
For some reason I lost the text output of FIO for this test, but heres a screen shot:
The same test at 5G (remember this is USB, so I think you can expect 2.5Gig PCIE cards to perform about the same)
and FIO at 5G:
Code:
C:\Users\nickf>fio --bs=128k --direct=1 --directory=y\:fio --gtod_reduce=1 --iodepth=32 --group_reporting --name=randrw --numjobs=12 --ramp_time=10 --runtime=60 --rw=randrw --size=256M --time_based
fio: this platform does not support process shared mutexes, forcing use of threads. Use the 'thread' option to get rid of this warning.
randrw: (g=0): rw=randrw, bs=(R) 128KiB-128KiB, (W) 128KiB-128KiB, (T) 128KiB-128KiB, ioengine=windowsaio, iodepth=32
...
fio-3.32
Starting 12 threads
Jobs: 12 (f=12): [m(12)][100.0%][r=91.9MiB/s,w=99.6MiB/s][r=735,w=796 IOPS][eta 00m:00s]
randrw: (groupid=0, jobs=12): err= 0: pid=13596: Tue Mar 7 23:23:48 2023
  read: IOPS=746, BW=93.7MiB/s (98.3MB/s)(5686MiB/60662msec)
   bw (  KiB/s): min=52492, max=136739, per=100.00%, avg=96116.32, stdev=1247.48, samples=1439
   iops        : min=  408, max= 1064, avg=747.91, stdev= 9.72, samples=1439
  write: IOPS=755, BW=94.8MiB/s (99.4MB/s)(5753MiB/60662msec); 0 zone resets
   bw (  KiB/s): min=59439, max=136208, per=100.00%, avg=97264.78, stdev=1200.72, samples=1439
   iops        : min=  463, max= 1062, avg=756.90, stdev= 9.36, samples=1439
  cpu          : usr=0.00%, sys=0.00%, ctx=0, majf=0, minf=0
  IO depths    : 1=0.0%, 2=0.0%, 4=0.0%, 8=0.0%, 16=6.8%, 32=93.2%, >=64=0.0%
     submit    : 0=0.0%, 4=100.0%, 8=0.0%, 16=0.0%, 32=0.0%, 64=0.0%, >=64=0.0%
     complete  : 0=0.0%, 4=99.9%, 8=0.1%, 16=0.1%, 32=0.1%, 64=0.0%, >=64=0.0%
     issued rwts: total=45295,45842,0,0 short=0,0,0,0 dropped=0,0,0,0
     latency   : target=0, window=0, percentile=100.00%, depth=32

Run status group 0 (all jobs):
   READ: bw=93.7MiB/s (98.3MB/s), 93.7MiB/s-93.7MiB/s (98.3MB/s-98.3MB/s), io=5686MiB (5962MB), run=60662-60662msec
  WRITE: bw=94.8MiB/s (99.4MB/s), 94.8MiB/s-94.8MiB/s (99.4MB/s-99.4MB/s), io=5753MiB (6032MB), run=60662-60662msec
I was going to test the relative performance of a SINGLE one of my test nodes, but it's getting late and TrueCommand/SCALE may be feature incomplete in that I can't seem to decom the cluster and go back to running a single node. This is still listed as experimental, so it's fine. I'll just wipe one of the test nodes and I'll update this thread with those results when I have some time.
I hope this helps some folks...and I hope I didn't perturb too many people by going off the beaten path and using a USB NIC @jgreco is probably screaming inside right now. In any case, my wife is going to have to deal with the electric bill from my big boy server a bit longer before moving to the hyperconverged and highly available SCALE cluster is ready for prime time.
Attachments
Last edited:
