I have added more ram, bringing the system to 64gb. I will wait now to see if it occurs again.
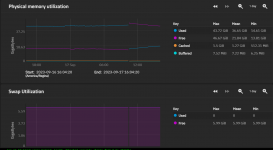
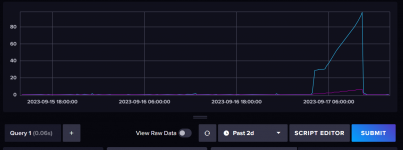
I did notice that overtime the swap seems to increase in use over the week prior to oom-killer kicking in.
I think if this happens again in a week, my next step will be to increase swap size and maybe add the command mentioned to a cron to sort of log the oom-killer a bit.
I have a small virtual private server running CentOS and www/mail/db, which has recently had a couple of incidents where the web server and ssh became unresponsive. Looking at the logs, I saw t...

serverfault.com
edit: I forgot to add, that I do notice this more when watching something on jellyfin, but that could just be noticable because that is the app I use the most.