
-
Important Announcement for the TrueNAS Community.
The TrueNAS Community has now been moved. This forum has become READ-ONLY for historical purposes. Please feel free to join us on the new TrueNAS Community Forums
You are using an out of date browser. It may not display this or other websites correctly.
You should upgrade or use an alternative browser.
You should upgrade or use an alternative browser.
Strange High Memory Usage by Services
- Thread starter farshidhss
- Start date
winnielinnie
MVP
- Joined
- Oct 22, 2019
- Messages
- 3,641
I'm equally stumped by this, currently on 12.0-U8. 
Is it a bug in displaying the RAM stats on the dashboard?
From a fresh reboot and starting two jails (Plex + qBittorrent), with SMB, Rsync, and SSH services running, Services takes up only 1 GB according to the dashboard.
However, as I start to read more and more data from my SMB shares, Services RAM consumption grows more and more, and in a very short amount of time it's using up 8.5 GB of a total RAM of 32 GB. (What is "Services" supposed to actually be, according to RAM usage?)
What does "Services" represent in the dashboard? The excess 6 GB or so that could go towards cache is being used up by what exactly? Or is it only a visual bug in the middleware?
UPDATE: I think I figured it out, maybe? I believe the Dashboard stats incorrectly interprets cache (used by a Plugin/Jail) as "Service", even if it is essentially "ZFS cache". (GUI / reporting issue; not underlying ZFS issue.)
Can someone else test this out? It's simple:
Correct me if I'm wrong, but even if a Plugin/Jail is caching data into RAM, this is technically still "ZFS Cache", even if the Plugin/Jail doesn't have true access/understanding of the "overarching ZFS-level of your pools and datasets".
So if a Plugin/Jail is reading a lot of data (which gets cached into RAM), the TrueNAS GUI Dashboard interprets it as RAM being consumed by "Services", even through this is really ZFS Cache? On the flip side, if you are reading a lot of data in cache via SMB, NFS, Rsync, etc, then the Dashboard will correctly interpret this as "ZFS Cache".
Is it a bug in displaying the RAM stats on the dashboard?
From a fresh reboot and starting two jails (Plex + qBittorrent), with SMB, Rsync, and SSH services running, Services takes up only 1 GB according to the dashboard.
However, as I start to read more and more data from my SMB shares, Services RAM consumption grows more and more, and in a very short amount of time it's using up 8.5 GB of a total RAM of 32 GB. (What is "Services" supposed to actually be, according to RAM usage?)
What does "Services" represent in the dashboard? The excess 6 GB or so that could go towards cache is being used up by what exactly? Or is it only a visual bug in the middleware?
UPDATE: I think I figured it out, maybe? I believe the Dashboard stats incorrectly interprets cache (used by a Plugin/Jail) as "Service", even if it is essentially "ZFS cache". (GUI / reporting issue; not underlying ZFS issue.)
Can someone else test this out? It's simple:
- Stop all Plugins/Jails. Disable auto-start for all Plugins/Jails.
- Reboot into a fresh environment.
- Immediately take note of how much RAM is consumed by "Services". <--- still not there yet
- Manually start up a Plugin/Jail (hopefully one that does a lot of reading, such as Plex or qBittorrent).
- Quickly note how much RAM is consumed by "Services" again. <--- still not there yet
- Now, from the Plugin/Jail, force it to read a lot of data, to fill up cache in your RAM. (Stream, stream, stream! Seed, seed, seed!)
- Monitor how the "Services" keeps climbing in the Dashboard display for your RAM.
- Make sure step #6 is done only from a Plugin/Jail; not from SMB, NFS, Rsync, or any non-jail approach
Correct me if I'm wrong, but even if a Plugin/Jail is caching data into RAM, this is technically still "ZFS Cache", even if the Plugin/Jail doesn't have true access/understanding of the "overarching ZFS-level of your pools and datasets".
So if a Plugin/Jail is reading a lot of data (which gets cached into RAM), the TrueNAS GUI Dashboard interprets it as RAM being consumed by "Services", even through this is really ZFS Cache? On the flip side, if you are reading a lot of data in cache via SMB, NFS, Rsync, etc, then the Dashboard will correctly interpret this as "ZFS Cache".
Last edited:
My TrueNAS server, a Microserver N54L with 16GB of ram is on 12-U8 and the memory behaviour has not changed since 12.0 release. i have no jails and a single RAIDZ1 pool of 4 x 4TB. Memory use classified on the GUI as services gradually rises over days to weeks. and average CPU use increases from about 20% to 40%. ZFS cache given by the GUI decreases from about 9GB to less than 2GB.
This is only partially improved by restarting middlewared and not at all by restarting collectd. So more than one memory leak seems to be going on in this rather underpowered server.
This is only partially improved by restarting middlewared and not at all by restarting collectd. So more than one memory leak seems to be going on in this rather underpowered server.
winnielinnie
MVP
- Joined
- Oct 22, 2019
- Messages
- 3,641
Dang. There goes my hypothesis.i have no jails
I wonder if it is a memory leak, or inaccurate reporting / interpretation by the GUI (middleware)?This is only partially improved by restarting middlewared and not at all by restarting collectd.
EDIT: That's really weird. I restarted the middlewared service, and my "Services" RAM consumption jumped from 5 GB to 10 GB.
I really hope 10 GB of RAM is not being wasted for "Services" (whatever that even means), when it could instead be used towards ZFS Cache (obviously preferred).
Last edited:
winnielinnie
MVP
- Joined
- Oct 22, 2019
- Messages
- 3,641
As you can see below, there's nothing that accounts for over 10 GB being used by "Services". I could see perhaps 2 GB, but 10 GB? How? Where? Why?
What am I missing?
Output from top -o res:
How? Where? Why?What am I missing?
Output from top -o res:
Code:
last pid: 27660;  load averages:  0.20,  0.26,  0.23                                                                                                                                                                 up 0+22:49:04  11:25:03
72 processes:  1 running, 71 sleeping
CPU:  0.0% user,  0.0% nice,  0.0% system,  0.0% interrupt,  100% idle
Mem: 978M Active, 516M Inact, 26G Wired, 3845M Free
ARC: 18G Total, 16G MFU, 617M MRU, 8704K Anon, 65M Header, 903M Other
     16G Compressed, 17G Uncompressed, 1.07:1 Ratio
Swap: 20G Total, 20G Free

  PID USERNAME    THR PRI NICE   SIZE    RES STATE    C   TIME    WCPU COMMAND
27422 root         22  27    0   380M   261M kqread   6   0:07   0.00% python3.9
27496 root          3  20    0   200M   166M usem     3   0:02   0.00% python3.9
27458 root          3  20    0   199M   165M usem     0   0:02   0.00% python3.9
27494 root          3  20    0   196M   163M piperd   5   0:02   0.00% python3.9
27495 root          3  20    0   196M   162M usem     0   0:02   0.00% python3.9
24764 winnie     11  20    0   213M   123M select   4   0:05   0.22% qbittorrent-nox
24124 root          1  20    0   129M   110M kqread   3   0:00   0.00% smbd
24135 root          1  20    0   127M   109M kqread   0   0:00   0.00% smbd
24137 root          1  20    0   127M   109M kqread   2   0:00   0.00% smbd
25530 plex         17  52    0   207M    80M uwait    7   0:02   0.04% Plex Media Server
24134 root          1  20    0    83M    64M kqread   3   0:00   0.00% winbindd
25567 plex         12  52   15   131M    60M piperd   4   0:02   0.01% Plex Script Host
27466 root          5  20    0    76M    57M usem     2   0:00   0.00% python3.9
27484 root          1  52    0    60M    50M zevent   4   0:00   0.00% python3.9
12831 root         11  20    0    82M    42M nanslp   6   3:33   0.00% collectd
24144 root          1  20    0    44M    25M kqread   5   0:00   0.00% winbindd
24133 root          1  20    0    43M    25M kqread   6   0:00   0.00% winbindd
25600 plex         11  20    0    48M    24M uwait    7   0:01   0.01% Plex Tuner Service
27424 root          1  26    0    22M    12M piperd   7   0:00   0.00% python3.9
 1403 root          8  20    0    44M    12M select   3   0:49   0.00% rrdcached
 1136 root          2  20    0    28M    11M kqread   1   0:02   0.00% syslog-ng
 1252 root          1 -52   r0    11M    11M nanslp   1   0:00   0.00% watchdogd
14215 www           1  20    0    37M    11M kqread   6   0:00   0.00% nginx
26660 root          1  20    0    19M  9012K select   4   0:00   0.00% sshd
 1415 root          1  20    0    35M  8976K pause    4   0:00   0.00% nginx
 1411 root          1  20    0    18M  8288K select   5   0:00   0.00% sshd
 1135 root          1  52    0    19M  8132K wait     7   0:00   0.00% syslog-ng
 1338 ntpd          1  20    0    18M  6740K select   5   0:02   0.00% ntpd
  434 root          1  20    0    17M  6348K select   6   0:00   0.00% zfsd
23588 root          1  20    0    15M  5756K nanslp   5   0:00   0.00% smartd
26694 root          1  20    0    13M  4628K pause    2   0:00   0.00% zsh
27644 root          1  20    0    13M  3980K CPU1     1   0:00   0.03% top
 1421 messagebus    1  52    0    12M  3696K select   7   0:00   0.00% dbus-daemon
24111 root          1  52    0    12M  3352K select   0   0:00   0.00% rsync
26693 root          1  21    0    12M  3240K wait     7   0:00   0.00% su
 1358 uucp          1  20    0    12M  3048K select   1   0:02   0.00% usbhid-ups
25380 _dhcp         1  28    0    12M  2932K select   6   0:00   0.00% dhclient
24645 _dhcp         1  21    0    12M  2932K select   4   0:00   0.00% dhclient
 1360 uucp          1  20    0    35M  2880K select   0   0:02   0.00% upsd
 1009 _dhcp         1  20    0    11M  2840K select   6   0:00   0.00% dhclient
 1363 uucp          1  20    0    11M  2828K nanslp   1   0:00   0.00% upslog
 1368 uucp          1  20    0    11M  2824K nanslp   5   0:01   0.00% upsmon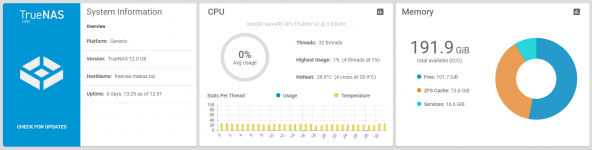
1366 root 1 52 0 11M 2816K piperd 7 0:00 0.00% upsmonSame issue with 384 GiB RAM. This weekend I enabled NFS to backup some config files for other systems, and this is a new development. The system is about 2 months old, and previously the graph was showing nearly all ZFS Cache - less than 10 GiB for Services.
The system is primarily used for VMware over iSCSI. After the NFS backup, I zeroed the free space on a 250 GiB thin provisioned drive and ran the VMware hole punching process to reclaim the blocks. The ARC Cache should have increased with all those iSCSI blocks, but didn't appear to. I think something is really reserving that RAM.
Nothing in htop or top comes close to 186 GiB.
The 177 GiB ZFS Cache from the graph matches what top shows for the ARC:
Elliot Dierksen
Guru
- Joined
- Dec 29, 2014
- Messages
- 1,135
I wonder if this is a bug in the reporting. The reason I say that is I just finished upgrading both my FreeNAS units to 12.0-U8, and I saw the same kind of thing. I run straight NFS from ESXi to FN. The ESXi hosts have some local storage I use for the occasionally for the 4 VM's that run all the time. When I used storage VMotion off FN data store, the ZFS usage dropped, and all that memory appeared to be associated with services. When I VMotioned the VM's back to FN, the ARC size went back up and the graph of free memory stayed the same. Perhaps it doesn't free the memory that was being used for ARC when FN doesn't think it needs it for that any longer.
Same issue with 384 GiB RAM. This weekend I enabled NFS to backup some config files for other systems, and this is a new development. The system is about 2 months old, and previously the graph was showing nearly all ZFS Cache - less than 10 GiB for Services.
The system is primarily used for VMware over iSCSI. After the NFS backup, I zeroed the free space on a 250 GiB thin provisioned drive and ran the VMware hole punching process to reclaim the blocks. The ARC Cache should have increased with all those iSCSI blocks, but didn't appear to. I think something is really reserving that RAM.
Nothing in htop or top comes close to 186 GiB.
The 177 GiB ZFS Cache from the graph matches what top shows for the ARC:
In VMware, I migrated the hole-punched virtual disk (it's now 36 GiB) to a SSD pool, and the system had to read and rewrite all the blocks used on the disk. The ARC increased with those writes - the services section shrunk down to 44 GiB, the ZFS Cache grew by about 30 GiB, and suddenly I have 138 GiB free:
I also think it's a reporting bug. Is there a bug report open on it that we can add our experiences to?
mistermanko
Guru
- Joined
- Jan 27, 2020
- Messages
- 577
Updated to U8, collect.d is at it again:


mistermanko
Guru
- Joined
- Jan 27, 2020
- Messages
- 577
Turns out I had graphite misconfigured under System>Reporting and collectd tried to connect to a long offlined jail.
I found out about in /var/log/messages, error like that:
Testing it with 0.0.0.0 as the remote (it's the standard I believe) for a day or two and will check if the error stays away...
I found out about in /var/log/messages, error like that:
Feb 23 20:14:29 truenas 1 2022-02-23T20:14:29.983691+01:00 truenas.xxx.de collectd 79701 - - write_graphite plugin: Connecting to 192.168.xxx.xxx:2003 via tcp failed. The last error was: failed to connect to remote host: Operation timed outTesting it with 0.0.0.0 as the remote (it's the standard I believe) for a day or two and will check if the error stays away...
mistermanko
Guru
- Joined
- Jan 27, 2020
- Messages
- 577
Does not work. write_graphite plugin still wants to connect to a nonexistent host.Testing it with 0.0.0.0 as the remote (it's the standard I believe) for a day or two and will check if the error stays away...
I'll leave the field empty than.
markope
Cadet
- Joined
- Jul 9, 2018
- Messages
- 3
Тhere is obviously a problem. Аfter upgrading to U8 ТN behaves strangely. First no longer uses all memory, second when i copy a larger file from my PC to TN with NFS or Samba, free memory increases and zfs ARC decreases and wired all the time is 135GB instead 181GB.Тhe upgrade was made on 17.02.2022 and from that moment all the problems began. I tried everything, deleting tunables and so on but problem exsist and performance are decreasing. After I returned to the U7 the system returned to normal.


Attachments
mistermanko
Guru
- Joined
- Jan 27, 2020
- Messages
- 577
I would try a fresh install of U8, create a samba share and try to replicate the issue, see if this changes something, so you can look at your config.Тhere is obviously a problem. Аfter upgrading to U8 ТN behaves strangely. First no longer uses all memory, second when i copy a larger file from my PC to TN with NFS or Samba, free memory increases and zfs ARC decreases and wired all the time is 135GB instead 181GB.Тhe upgrade was made on 17.02.2022 and from that moment all the problems began. I tried everything, deleting tunables and so on but problem exsist and performance are decreasing. After I returned to the U7 the system returned to normal.
View attachment 53637 View attachment 53634
View attachment 53635
markope
Cadet
- Joined
- Jul 9, 2018
- Messages
- 3
I solved the problem. Namely, the problem is in the layout of the memory chips distributed for each processor separately. I do not know for what reasons but ZFS looks at the amount of memory for each processor separately and determines the amount for ARC according to the least allocated memory. In my case it was asymmetric for processor 1 was 128GB for processor 2 64GB, after I arranged them symmetrically 2 x 96GB the system works perfectly.Тhere is obviously a problem. Аfter upgrading to U8 ТN behaves strangely. First no longer uses all memory, second when i copy a larger file from my PC to TN with NFS or Samba, free memory increases and zfs ARC decreases and wired all the time is 135GB instead 181GB.Тhe upgrade was made on 17.02.2022 and from that moment all the problems began. I tried everything, deleting tunables and so on but problem exsist and performance are decreasing. After I returned to the U7 the system returned to normal.
View attachment 53637 View attachment 53634
View attachment 53635
alpha_1001
Cadet
- Joined
- May 5, 2022
- Messages
- 2
I am also having this problem ladies and gentlemen. HTOP shows a little over 2gigs of ram usage while GUI shows 12gigs of usage and I have a 16gigs of ram installed. So it's eating all of my ram for some reason but it wont show at htop which am assuming htop disregards any VMs running etc. Tunables are on.
alpha_1001
Cadet
- Joined
- May 5, 2022
- Messages
- 2
I am also having the same problem.
Seani
Dabbler
- Joined
- Oct 18, 2016
- Messages
- 41
View attachment 55242
Same here. After a reboot the RAM usage sits at sub 10GB for Services and then slowly ramps up over time. I'm on TrueNAS-12.0-U8.1.
And this is what it looks like half an hour after a reboot.
GeorgePatches
Dabbler
- Joined
- Dec 10, 2019
- Messages
- 39
Just want to throw my issue on the pile here. Having the same issue that most people have described, high "services" and "wired" memory usage that is not ARC nor explained by any process listed in top -o res. Everything seems to look normal, except there's a bunch of memory (~5G for me) my ARC can't use. Even tried restarting collectd and middlewared as others have described them as the issue, but there was no change. The only fix is restarting, but the cause remains unclear.
Important Announcement for the TrueNAS Community.
The TrueNAS Community has now been moved. This forum will now become READ-ONLY for historical purposes. Please feel free to join us on the new TrueNAS Community Forums.Related topics on forums.truenas.com for thread: "Strange High Memory Usage by Services"
Similar threads
- Replies
- 5
- Views
- 6K
- Replies
- 8
- Views
- 7K