danb35
Hall of Famer
- Joined
- Aug 16, 2011
- Messages
- 15,504
I updated my main FreeNAS server (on 11.3-Usomething) to TN 12.0-U1 a couple of weeks ago. Everything in general seems to be working fine--jails work, sharing works, the GUI works, no big surprises. Except...
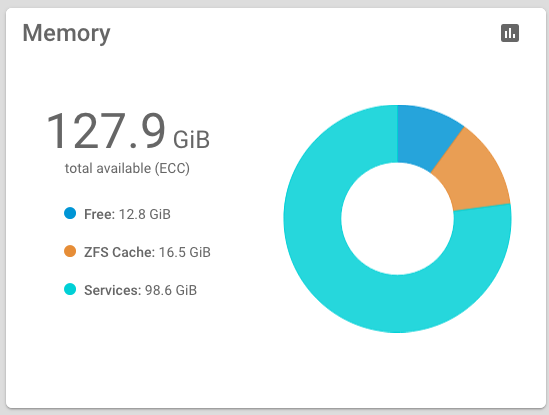
I logged into the GUI yesterday morning and was surprised to see this:

That's pretty unusual; with prior releases I'd expect the numbers for "ZFS Cache" and "Services" to be roughly reversed. htop indicates that collectd is consuming huge amounts of RAM, far more than any other process:

I can't show any data from the Reporting pages, as they don't work--seems that's a 12.0 bug yet to be fixed. What's up with this?
I logged into the GUI yesterday morning and was surprised to see this:
That's pretty unusual; with prior releases I'd expect the numbers for "ZFS Cache" and "Services" to be roughly reversed. htop indicates that collectd is consuming huge amounts of RAM, far more than any other process:
I can't show any data from the Reporting pages, as they don't work--seems that's a 12.0 bug yet to be fixed. What's up with this?
