I'm having repeated "crashes" on my Truenas scale system that i am thinking may be happening due to hardware inefficiencies.
At seemingly random times my trueNAS wont entirely shut down, but appears to almost go into a sleep state. My webui will disappear and a screen comes up saying "waiting for Active TrueNAS controller to come up" for about a minute until it all comes back up, but without any apps running. (first Screenshot)
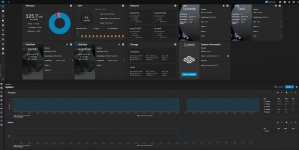
Going to "reporting>system" shows that there is repeated downtime on the system (Screenshot 2)
however going to /var/logs/messages and checking the logs around those times isn't showing anything that seems out of the ordinary. worryingly there doesn't appear to be anything at all near those times (attached logs from around the problem times)
if anyone more familiar with truenas scale logs wouldn't mind taking a look i would love you forever.
the log files are a bit long, but I have timestamps for when the crashes occurred in the last ~hour
The timestamps for the crashes are.
09:23:10
09:25:50
09:33:20
10:13:50
10:16:40
View attachment 62418
View attachment 62419
Running an i5 10600
16 GB of DDR4 3600
a corsair gold rated 650W PSU (Im hoping is the culprit and i just need more wattage)
9 6TB seagate ironwolf Pro
3 16TB Seagate Exos
noctua NH-D9L
and a mzhou sata expansion PCIE card
An m.2 nvme boot drive (edited)
[10:50 AM]
The Issue did seemingly occur after i put in the 3 new 16TB Exos Drives. So im hoping my PSU just couldnt handle that much.
I have attached the log files for about an hour where the crashes were occuring. I also have the full log files if anyone thinks they might be more revealing.
Thanks again in advance.
o/ Hello Sven...
I'm not sure if this will help any, but generally 'more information' can be good for finding the root problem.
I had recently upgraded to
22.12/Bluefin and had also put an
Intel Pro1000 (4x 1GB) NIC in place of a dual 10GB Fiber card in order to keep transferring / uploading my data while waiting on the replacement.
I was able to create a bond w/ 2 of the ports (#3 & #4) and then set up ports #1/#2 for DMZ (one with VPN, one without).
Everything looked fine, etc, however when attempting to upload to the Bonded Interface with a Filezilla client, I noticed all sorts of weirdness, specifically with the connection seeming very slow, and when it would finally resolve, it only would upload -exactly- 65,553 bytes of a media file.
While troubleshooting this issue, I went back to my 'management' interface (built in 1GB NIC on the Mobo) and the problem went away, so I figured there must be something messed up with the card, even thought it had worked in the Ubuntu rack mount server I had borrowed it from.
Interesting thing, however, is that I had both of the interfaces open (both my x.100.7 / management, and my x.140.7 / Bonded pair) and while the management / x.100.7 / onboard NIC had no issues, the bonded pair / x.140.7 repeatedly would refresh with the 'Waiting for Active TrueNAS controller to come up...',
which is how I stumbled across your thread here.
I did a couple of reboots (including a complete cold shutdown) and the issue persists (again, only on the bonded Intel NIC), and upon inspecting my own logs, the one thing that stands out to me (timeframe wise) is the following:
Jan 14 16:12:26 TrueNAS_Scale kernel: bond0: (slave enp38s0f0): Enslaving as a backup interface with a down link
Jan 14 16:12:27 TrueNAS_Scale kernel: bond0: (slave enp38s0f1): Enslaving as a backup interface with a down link
Jan 14 16:12:27 TrueNAS_Scale kernel: Generic FE-GE Realtek PHY r8169-0-2a00:00: attached PHY driver (mii_bus:phy_addr=r8169-0-2a00:00, irq=MAC)
Jan 14 16:12:27 TrueNAS_Scale kernel: r8169 0000:2a:00.0 enp42s0: Link is Down
Jan 14 16:12:28 TrueNAS_Scale kernel: e1000e 0000:26:00.0 enp38s0f0: NIC Link is Up 1000 Mbps Full Duplex, Flow Control: Rx
Jan 14 16:12:28 TrueNAS_Scale kernel: bond0: (slave enp38s0f0): link status definitely up, 1000 Mbps full duplex
Jan 14 16:12:28 TrueNAS_Scale kernel: bond0: Warning: No 802.3ad response from the link partner for any adapters in the bond
Jan 14 16:12:28 TrueNAS_Scale kernel: bond0: active interface up!
Jan 14 16:12:28 TrueNAS_Scale kernel: IPv6: ADDRCONF(NETDEV_CHANGE): bond0: link becomes ready
Jan 14 16:12:29 TrueNAS_Scale kernel: e1000e 0000:26:00.1 enp38s0f1: NIC Link is Up 1000 Mbps Full Duplex, Flow Control: Rx
Jan 14 16:12:29 TrueNAS_Scale kernel: bond0: (slave enp38s0f1): link status definitely up, 1000 Mbps full duplex
Jan 14 16:12:30 TrueNAS_Scale kernel: e1000e 0000:25:00.1 enp37s0f1: NIC Link is Up 1000 Mbps Full Duplex, Flow Control: Rx
Jan 14 16:12:30 TrueNAS_Scale kernel: IPv6: ADDRCONF(NETDEV_CHANGE): enp37s0f1: link becomes ready
Jan 14 16:12:30 TrueNAS_Scale kernel: e1000e 0000:25:00.0 enp37s0f0: NIC Link is Up 1000 Mbps Full Duplex, Flow Control: Rx
Jan 14 16:12:30 TrueNAS_Scale kernel: IPv6: ADDRCONF(NETDEV_CHANGE): enp37s0f0: link becomes ready
Jan 14 16:12:31 TrueNAS_Scale kernel: r8169 0000:2a:00.0 enp42s0: Link is Up - 1Gbps/Full - flow control rx
Jan 14 16:12:31 TrueNAS_Scale kernel: IPv6: ADDRCONF(NETDEV_CHANGE): enp42s0: link becomes ready
Jan 14 16:12:39 TrueNAS_Scale proftpd[8211]: 127.0.0.1 - ProFTPD 1.3.7a (maint) (built Sat Sep 18 2021 21:42:19 UTC) standalone mode STARTUP
Jan 14 16:12:43 TrueNAS_Scale kernel: bridge: filtering via arp/ip/ip6tables is no longer available by default. Update your scripts to load br_netfilter if you need this.
Jan 14 16:12:43 TrueNAS_Scale kernel: Bridge firewalling registered
Jan 14 16:12:49 TrueNAS_Scale kernel: nvidia_uvm: module uses symbols from proprietary module nvidia, inheriting taint.
Jan 14 16:12:49 TrueNAS_Scale kernel: nvidia-uvm: Loaded the UVM driver, major device number 237.
Jan 14 16:12:49 TrueNAS_Scale kernel: IPVS: Registered protocols (TCP, UDP, SCTP, AH, ESP)
Jan 14 16:12:49 TrueNAS_Scale kernel: IPVS: Connection hash table configured (size=4096, memory=32Kbytes)
Jan 14 16:12:49 TrueNAS_Scale kernel: IPVS: ipvs loaded.
Jan 14 16:12:50 TrueNAS_Scale kernel: IPVS: [rr] scheduler registered.
Jan 14 16:13:00 TrueNAS_Scale kernel: IPv6: ADDRCONF(NETDEV_CHANGE): veth91d744d7: link becomes ready
Jan 14 16:13:00 TrueNAS_Scale kernel: kube-bridge: port 1(veth91d744d7) entered blocking state
Jan 14 16:13:00 TrueNAS_Scale kernel: kube-bridge: port 1(veth91d744d7) entered disabled state
Jan 14 16:13:00 TrueNAS_Scale kernel: device veth91d744d7 entered promiscuous mode
Jan 14 16:13:00 TrueNAS_Scale kernel: kube-bridge: port 1(veth91d744d7) entered blocking state
Jan 14 16:13:00 TrueNAS_Scale kernel: kube-bridge: port 1(veth91d744d7) entered forwarding state
Jan 14 16:13:00 TrueNAS_Scale kernel: IPv6: ADDRCONF(NETDEV_CHANGE): veth434b44d3: link becomes ready
Jan 14 16:13:00 TrueNAS_Scale kernel: kube-bridge: port 2(veth434b44d3) entered blocking state
Jan 14 16:13:00 TrueNAS_Scale kernel: kube-bridge: port 2(veth434b44d3) entered disabled state
Jan 14 16:13:00 TrueNAS_Scale kernel: device veth434b44d3 entered promiscuous mode
Jan 14 16:13:00 TrueNAS_Scale kernel: kube-bridge: port 2(veth434b44d3) entered blocking state
Jan 14 16:13:00 TrueNAS_Scale kernel: kube-bridge: port 2(veth434b44d3) entered forwarding state
Jan 14 16:13:00 TrueNAS_Scale kernel: Initializing XFRM netlink socket
Jan 14 16:13:00 TrueNAS_Scale kernel: kube-bridge: port 3(vethdde9f00a) entered blocking state
Jan 14 16:13:00 TrueNAS_Scale kernel: kube-bridge: port 3(vethdde9f00a) entered disabled state
Jan 14 16:13:00 TrueNAS_Scale kernel: device vethdde9f00a entered promiscuous mode
*****
*****
Which continues to repeat in a loop, with the port numbers increasing/changing, e.g. :
port 3(vethdde9f00a)
device veth7d64a95b entered promiscuous mode
port 4(veth7d64a95b)
port 5(veth87796a49)
device veth87796a49 entered promiscuous mode
port 6(veth796dd8c1)
port 7(veth80484f74)
device veth80484f74 entered promiscuous mode
Now, hopefully somebody with more experience than myself (TrueNAS newb) can look at these logs and see if these are normal K8 messages, but in the /var/logs/messages, this is the only thing I see of note?
If we get some TrueNAS Scale smart peeps on it, I can provide additional/full logs and/or do any troubleshooting if it will help the cause. In the meantime, I'm going to crack it open, reseat the card, make sure nothing looks weird in the BIOS again and see if the problem persists.
Attaching my screenshot, and my system specs are:
AMD Ryzen 5500 (6core/12thread 4.2GHz)
128GB DDR4 (4x 32GB @ 3600)
2x Kingston A400 SSD (120GB OS / Mirrored)
2x Samsung 870 Evo SSD ( 1TB Cache / Striped)
2x Samsung 980 nVME (2TB Apps/VMs/etc / Mirrored)
2x Kingston DC500M ( 500G SLOG / Mirrored)
8x WD Red+ Spinners (84TB Storage / RAID Z2)
1.6KW EVGA PSU
PCI
SAS 9211 8I (Flashed to IT for HBA Mode)
Intel Pro/1000 PT Quad Port NIC (4x 1GB)
*** Currently have an nVidia 1070 that I'm going to rip out and replace since I can't pass it through to JellyFin, and run it off of a different machine.
I'll post back if I have any news and hopefully this piques the interest of others!
g/l
~A