smbd memory leak

barbierimc

Dabbler
Joined
Jun 25, 2016
Messages
22
In the past I've noticed available memory slowly declining but haven't cared too much. Now this problem has become worse,

It seems to coincide with moving from FreeNAS to TrueNAS (I jumped straight to 12.0-U2.1 on 27 Feb from FreeNAS 11). Now running TrueNAS Core 12.0-U3 and it is still an issue.

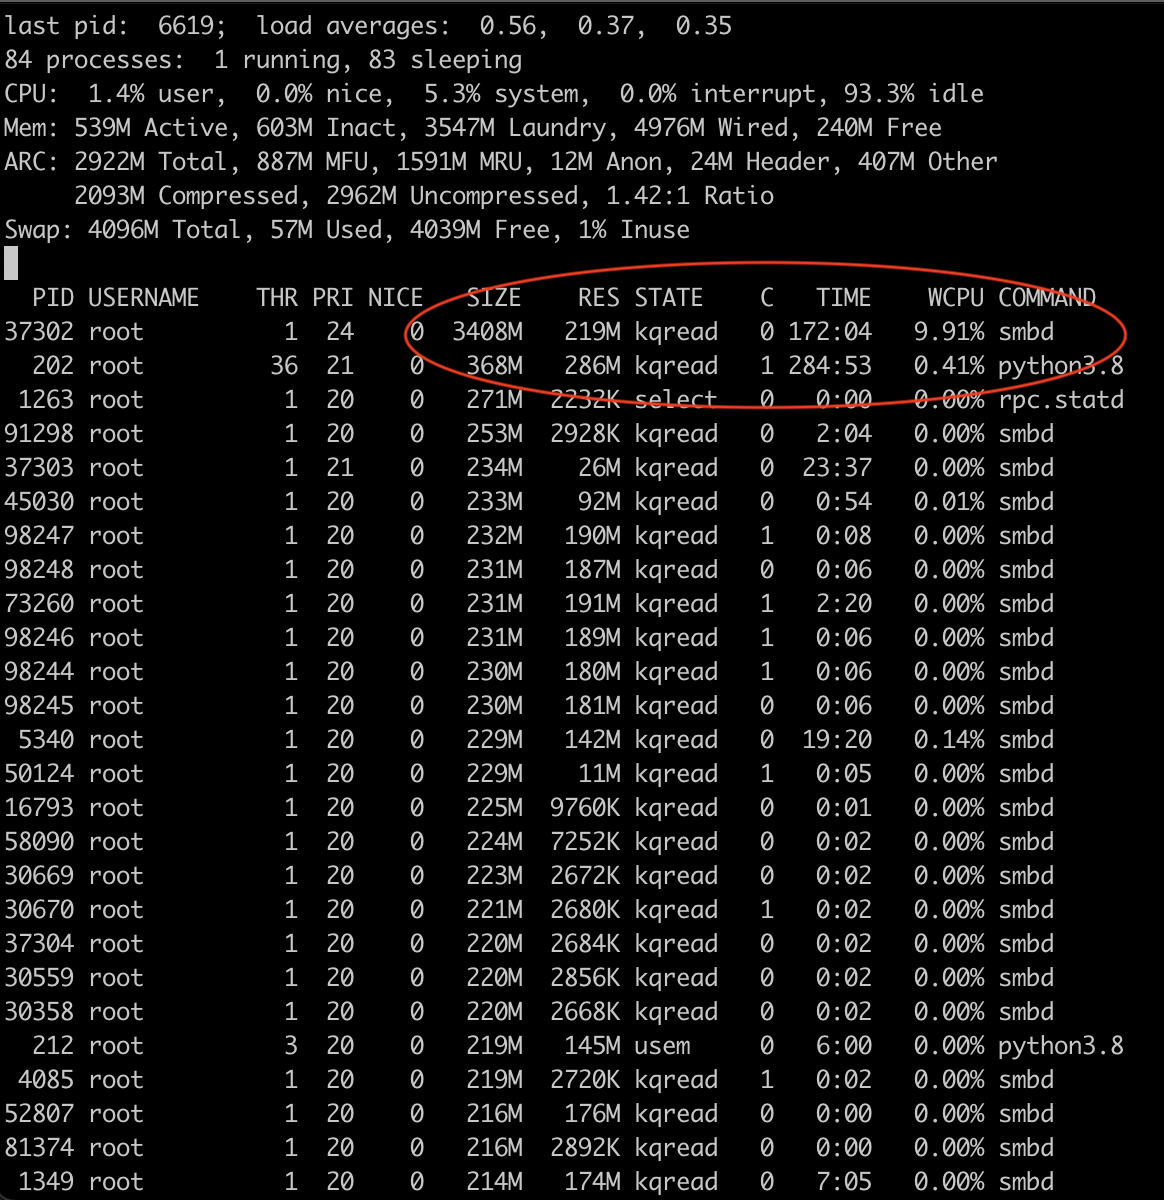
I have one smbd process whose memory usage rises continuously until swap is used, then eventually the process is killed by the system when it runs out of memory. It's always the process that is connected to a particular debian 10 machine and the share is fairly heavily utilised. Other shares connected to other debian 10 machines (with a much reduced workload) don't show his issue, so I expect it is workload related. If I stop all the workloads on the client, cpu usage for this process drops to 0%, but the process memory usage doesn't reduce.

I can't give you steps to reproduce, but for me it occurs consistently on this share & workload, so I can easily collect data, etc to help track this down.

I'm sure you're going to want more info, tell me what's useful and I'll give you what you need.

This is what I see in the charts.
1619180796514.png

1619177744243.png


1619178820775.png


Share config
ea support = No
hide dot files = No
kernel share modes = No
mangled names = no
path = /mnt/tank/share
posix locking = No
read only = No
vfs objects = catia fruit streams_xattr shadow_copy_zfs ixnas crossrename recycle aio_fbsd
recycle:exclude = *.tmp
recycle:subdir_mode = 0700
recycle:directory_mode = 0777
recycle:touch = yes
recycle:versions = yes
recycle:keeptree = yes
recycle:repository = .recycle/%U
fruit:resource = stream
fruit:metadata = stream
fruit:encoding = native
nfs4:chown = true
 

anodos

Sambassador
iXsystems
Joined
Mar 6, 2014
Messages
9,554
Can you PM me a debug please? System->Advanced->Save Debug. If you don't feel comfortable sending it via forumware, tell me in a PM and I'll give you my email address.
 

lancing

Cadet
Joined
Apr 27, 2021
Messages
7
I can't say if its SMB causing it or not but I have also noticed a memory leak since upgrading to TrueNAS-12.0-U3.

Services will boot at a fixed level then slowly continues to increase the amount of RAM usage by around a gig or two a day until I run out. This is a new behavior since upgrading.
 

anodos

Sambassador
iXsystems
Joined
Mar 6, 2014
Messages
9,554
I can't say if its SMB causing it or not but I have also noticed a memory leak since upgrading to TrueNAS-12.0-U3.

Services will boot at a fixed level then slowly continues to increase the amount of RAM usage by around a gig or two a day until I run out. This is a new behavior since upgrading.
If samba is leaking memory you will see one or more smbd process have RES column grow without stopping. If this is the case and wasn't in U2.1, please let me know because we did have a samba update between the two TrueNAS versions. It will give me a reference point to bisect to the issue.
 

lancing

Cadet
Joined
Apr 27, 2021
Messages
7
If samba is leaking memory you will see one or more smbd process have RES column grow without stopping. If this is the case and wasn't in U2.1, please let me know because we did have a samba update between the two TrueNAS versions. It will give me a reference point to bisect to the issue.

Okay, confirmed its not SMB.

I tried disabling persistent L2 ARC in case that was causing it but no dice.

I have a few things showing a larger RES (nginx, transmission, ntpd) but I'll need to do a reboot and keep an eye on them to figure out which one is growing over time. Will get back once I narrow it down.
 

anodos

Sambassador
iXsystems
Joined
Mar 6, 2014
Messages
9,554
Okay, confirmed its not SMB.

I tried disabling persistent L2 ARC in case that was causing it but no dice.

I have a few things showing a larger RES (nginx, transmission, ntpd) but I'll need to do a reboot and keep an eye on them to figure out which one is growing over time. Will get back once I narrow it down.
We also have some tmpfs filesystems on TrueNAS. It might be worth checking that something isn't filling them up df -hT, I think I saw a ticket where cloudsync was writing multiple GiB of logs to tmpfs.
 

lancing

Cadet
Joined
Apr 27, 2021
Messages
7
We also have some tmpfs filesystems on TrueNAS. It might be worth checking that something isn't filling them up df -hT, I think I saw a ticket where cloudsync was writing multiple GiB of logs to tmpfs.

I'll need to wait until after hours to reboot the box as its in use right now.

Not using CloudSync on the box, only services are a single W10 VM and Transmission and SMB but I ran the 'df -hT' command to look at the tmpfs and got this:

tmpfs.jpg
 

lancing

Cadet
Joined
Apr 27, 2021
Messages
7
Here is the follow on. I go from Services at around 14-15GB to Services at 20GB plus in about a day.

I have a single Windows 10 VM, Transmission and SMB running with 3 storage pools.

Right after boot:
boot plus 10.jpg


This is after about 23 hours:
boot plus 23 hours.jpg


The htop after 23 hours as well:
htop.jpg


memtile.jpg


No idea what is causing it.
 

alpha754293

Dabbler
Joined
Jul 18, 2019
Messages
47
If samba is leaking memory you will see one or more smbd process have RES column grow without stopping. If this is the case and wasn't in U2.1, please let me know because we did have a samba update between the two TrueNAS versions. It will give me a reference point to bisect to the issue.
I appear to be having this problem with Samba. (I found this thread by googling the issue.)

I'm running TrueNAS Core 12.0-U1.1.
Capture.JPG


Capture.PNG


Any help or suggestions or advice in regards to how I can either prevent this from happening in TrueNAS Core 12.0-U1.1 or what is the recommended solution in regards to this would be greatly appreciated.

Thank you.
 

anodos

Sambassador
iXsystems
Joined
Mar 6, 2014
Messages
9,554
I appear to be having this problem with Samba. (I found this thread by googling the issue.)

I'm running TrueNAS Core 12.0-U1.1.
View attachment 58089


View attachment 58090

Any help or suggestions or advice in regards to how I can either prevent this from happening in TrueNAS Core 12.0-U1.1 or what is the recommended solution in regards to this would be greatly appreciated.

Thank you.
None of your smbd processes appear to be consuming an undue amount of RAM. That said, the only thing you can do to fix an issue in 12.0-U1.1 is to upgrade.
 

alpha754293

Dabbler
Joined
Jul 18, 2019
Messages
47
None of your smbd processes appear to be consuming an undue amount of RAM. That said, the only thing you can do to fix an issue in 12.0-U1.1 is to upgrade.
Stupid question then - given that the services are consuming a total of 13.3 GiB of RAM, is there a way to easily and readily get a breakdown on how much RAM each service is consuming?

I am asking specifically about smbd because unchecked or if I leave it go, the system will eventually print errors to the console where I won't even be able to log in nor reboot the system anymore because "smbd" has either consumed the rest of the free RAM and/or it starts throwing errors and I'm not sure if those error messages that are printed to console are written to a log somewhere as the system becomes completely unresponsive.
 

barbierimc

Dabbler
Joined
Jun 25, 2016
Messages
22
Stupid question then - given that the services are consuming a total of 13.3 GiB of RAM, is there a way to easily and readily get a breakdown on how much RAM each service is consuming?

I am asking specifically about smbd because unchecked or if I leave it go, the system will eventually print errors to the console where I won't even be able to log in nor reboot the system anymore because "smbd" has either consumed the rest of the free RAM and/or it starts throwing errors and I'm not sure if those error messages that are printed to console are written to a log somewhere as the system becomes completely unresponsive.
Have you tried sorting the process list by memory usage?

top -o res
 

alpha754293

Dabbler
Joined
Jul 18, 2019
Messages
47
Have you tried sorting the process list by memory usage?

top -o res
Thank you. Yes, I just tried that.

This is what I see:
Capture.PNG


But I wonder if say either the NFS daemon (if it uses one) and/or the iSCSI daemon (for example) uses more RAM than other services.

(Sidebar: My frame of reference for this question comes from the QNAP QTS OS where I can display a list of the services that the NAS is hosting and the RAM that it takes from the GUI. With top, it will just show all processes on the system, and not just the services that are consuming the 13.3 GiB of RAM that have been identified as "services" on the home screen of the TrueNAS dashboard. So, my thinking was that if the home screen of the dashboard can tell me that, there has to be a way that it knows what is a service and what isn't, and therefore; it should be or ought to be able to provide a breakdown of what that 13.3 GiB of RAM that has been consumed consists of -- i.e. how much each of those services are consuming.)

Capture.PNG


Hope that helps clarify the background to my question.

Thank you.
 

alpha754293

Dabbler
Joined
Jul 18, 2019
Messages
47
If you have a particlaurly high mem process, then try

ps -auxwww -p <pid>
Thank you.

Another stupid question - how would I be able to find out which service is causing said high memory usage?

My assumption is that for the above command to work, I would need to know what the <pid> is.

My stupid question is "how do I find out what the PID is?"

Given, again, the command:

Code:
top -o res


will only show all processes, not only just the "service" processes.

Is there a way to get the system to show "just" or "only" the process that TrueNAS (in the memory pie chart) that said TrueNAS has deemed to be "services"?

I am assuming that if it can tell me that 13.3 GiB of RAM is used for services, that the system knows enough information to make that pie chart.

Therefore; given that assumption, is there a way to probe what is the memory that are being used by the "service" processes?

And if I am able to get the system to be able to tell me which of the "service" processes is consuming a large amount of RAM, then I would be able to get the PID for that process so that I can use the command above to be able to figure out how much RAM that process is using.

I hope that makes sense.

Thank you.
 

barbierimc

Dabbler
Joined
Jun 25, 2016
Messages
22
I would just look at the 5 processes that have the highest memory usage using top. Then check each one of those pid's using the ps command which will give more detail about the process. I think that will give you a good hint as to what's got the highest footprint. So for example, try the pythhon3.8 process (297) in your screenshot above and see what it tells you (if that process still exists of course!)
 
Joined
Jan 27, 2020
Messages
577
I appear to be having this problem with Samba. (I found this thread by googling the issue.)

I'm running TrueNAS Core 12.0-U1.1.
View attachment 58089


View attachment 58090

Any help or suggestions or advice in regards to how I can either prevent this from happening in TrueNAS Core 12.0-U1.1 or what is the recommended solution in regards to this would be greatly appreciated.

Thank you.
Is your system bottlenecking in any way? What do you want to "prevent" - as you say?
TrueNAS is just using all available memory. If you're concerned about low ZFS cache - as along as there is no swap in use don't worry about it.
With little activity on your zfs pools but lots of services running, RAM is used in favor of services.
 

alpha754293

Dabbler
Joined
Jul 18, 2019
Messages
47
I would just look at the 5 processes that have the highest memory usage using top. Then check each one of those pid's using the ps command which will give more detail about the process. I think that will give you a good hint as to what's got the highest footprint. So for example, try the pythhon3.8 process (297) in your screenshot above and see what it tells you (if that process still exists of course!)
This is what I get when I did that:

Capture.PNG


Is your system bottlenecking in any way? What do you want to "prevent" - as you say?
TrueNAS is just using all available memory. If you're concerned about low ZFS cache - as along as there is no swap in use don't worry about it.
With little activity on your zfs pools but lots of services running, RAM is used in favor of services.
The specific error state that I am trying to prevent is that if I let the service processes consume as much RAM as it wants, eventually, the system will report that there's a problem with smbd (something along the lines of smb out of memory) or something like that to the console and the system will no longer be responsive at all to the point where I can't even connect to it remotely anymore using any and all means (webUI, ssh, etc.).

So that is the specific error state that I am trying to avoid/solve.

Thank you.

(Sidebar: I don't have any jails running or anything like that. Just Samba, NFS, SMART, and ssh.)

And the RAM used by "services" has now crept upto 13.9 GiB since I started posting here.

I also, further, understand how ZFS uses system RAM as cache. But you can see from the picture below, that only 1.7 GiB out of 16 GB of RAM is used for that purpose.

The significant majority (13.9 GiB or 87.4%) is being used by "services".

And what I would like to probe deeper is what makes up that "services" in that pie chart that's shown on the dashboard. Again, I am working on the assumption that if it can create that pie chart, then the system knows what makes up that part of said pie chart, and therefore; I should be able to probe deeper into what that "service" part of the pie chart actually consists of.

Thank you.

Capture.PNG
 
Last edited:
Joined
Jan 27, 2020
Messages
577
The pie chart is just a representation of the what topis also showing, see:

1662061373083.png


1662061395076.png

The specific error state that I am trying to prevent is that if I let the service processes consume as much RAM as it wants, eventually, the system will report that there's a problem with smbd (something along the lines of smb out of memory) or something like that to the console and the system will no longer be responsive at all to the point where I can't even connect to it remotely anymore using any and all means (webUI, ssh, etc.).

If smbd will lock up your system, there is something fundamentally out of order with your system that you either should report a jira ticket or recheck, if your system is in any way incompatible with TN or has some kind of defect.

Can you share a log file where you've found that error message regarding smbd?
 

barbierimc

Dabbler
Joined
Jun 25, 2016
Messages
22
I agree, I'm not convinced you have a problem, but keep an eye on process 297 and also look at the built in RAM/SWAP chart. Does SWAP usage start to increase at any stage, and does it coincide with an increase in usage from this same (or any other) process?

If these things don't happen then I agree your problem lies elsewhere. Upgrading to the latest 12.0 update should be a first step otherwise you may be trying to solve a problem that might already be fixed.
 
Top