smartctl failed (was interrupted) due to a planned reboot, how to clear the 'unhealthy' flag on the affected pools

NeWizz_

Dabbler
Joined
Feb 12, 2023
Messages
10
Hi, I'm pretty new to TrueNas and Scale, so please bear with me and feel free to point out anything I should do differently.

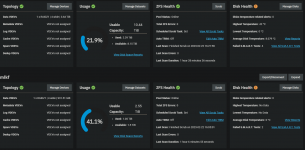
I just spotted that both my hdd's pools (4*seagate compute 1T and 4*seagate ironwolf 4T) were showing as 'unhealthy' in the GUI. I decided to start a manual long smartctl test using the GUI, which is ongoing on every one of those 8 drives, soon to find that was pointless.

After doing a bit of digging into it, I found out that the failed test happened a long time back (why didn't I spot it sooner is a mystery to me, maybe the update to TrueNAS-SCALE-22.12.1 is what allowed it to pop up?. So I logged into the server by ssh and used smartctl -x /dev/sd% in order to get all the relevant info for each of the affected drives. The failed test reports that it was interrupted (Extended offline Interrupted (host reset)), and therefore is simply a piece of information and not relevant to the health of said drives. The same drives cleared 7 smartctl scans since that happened, over the span of 900 hours of use.

So my question is, how do I clear that unhealthy flag from my GUI, as it's misleading and obstructing potentially important info if my pools were to really fail? I've looked around, and people mention a temporary folder for smart warnings but I can't find it.

Any help would be appreciated, thanks!
 

Samuel Tai

Never underestimate your own stupidity
Moderator
Joined
Apr 24, 2020
Messages
5,399
I suspect you'll need to do something like removing the drive from the pool, secure erasing it, and then adding it back to the pool.
 

Patrick M. Hausen

Hall of Famer
Joined
Nov 25, 2013
Messages
7,776
I don't think a failed SMART test has got any effect on the ZFS pool status. What is the output of zpool status?
 

NeWizz_

Dabbler
Joined
Feb 12, 2023
Messages
10
I don't think a failed SMART test has got any effect on the ZFS pool status. What is the output of zpool status?
I'll attach a screenshot as to what the GUI is reporting. ZFS pool is healthy, the os gives a warning regarding smartctl, and I've got absolutely no clue as to why it appeared (or I do? the update?), nor as any way to remove it.

I'll also attach the zpool status so that you can confirm that.
Code:
admin@truenas[~]$ sudo zpool status mlkf && sudo zpool status media
  pool: mlkf
 state: ONLINE
  scan: scrub repaired 0B in 01:06:55 with 0 errors on Wed Feb 22 16:05:01 2023
config:

        NAME                                      STATE     READ WRITE CKSUM
        mlkf                                      ONLINE       0     0     0
          raidz1-0                                ONLINE       0     0     0
            2d4ec267-442b-4a28-9b22-bd1354f5dd20  ONLINE       0     0     0
            498467f7-ee34-4cf3-94a5-daf1528f66d7  ONLINE       0     0     0
            8e25e792-1e38-4460-832f-17d8c26fc724  ONLINE       0     0     0
            33a32ff6-00e7-4daf-a52c-e68accdd6ffc  ONLINE       0     0     0

errors: No known data errors
  pool: media
 state: ONLINE
  scan: scrub repaired 0B in 01:28:36 with 0 errors on Wed Feb 22 16:27:59 2023
config:

        NAME                                      STATE     READ WRITE CKSUM
        media                                     ONLINE       0     0     0
          raidz1-0                                ONLINE       0     0     0
            aa57f5dd-504b-4aa3-a950-368da70ec69f  ONLINE       0     0     0
            7d0d5702-e483-4082-b176-7c75c9a428c8  ONLINE       0     0     0
            f7a453e6-378c-4ff1-911a-b859e9cb6d94  ONLINE       0     0     0
            cc89efc9-5ff3-4d90-92ee-da7bd9c7ada8  ONLINE       0     0     0

errors: No known data errors


Below you'll be able to find the smartctl -x output for one of the affected drives (pool is mlkf, and yes I know it's very old, btw if anyone knows if I should do the firmware update and why, please let me know). The failed test is listed as #12.
Code:
admin@truenas[~]$ sudo smartctl -x /dev/sda
[sudo] password for admin:
smartctl 7.2 2020-12-30 r5155 [x86_64-linux-5.15.79+truenas] (local build)
Copyright (C) 2002-20, Bruce Allen, Christian Franke, www.smartmontools.org

=== START OF INFORMATION SECTION ===
Model Family:     Seagate Barracuda 7200.12
Device Model:     ST31000528AS
Serial Number:    6VP4MQA4
LU WWN Device Id: 5 000c50 027891fce
Firmware Version: CC38
User Capacity:    1,000,204,886,016 bytes [1.00 TB]
Sector Size:      512 bytes logical/physical
Rotation Rate:    7200 rpm
Device is:        In smartctl database [for details use: -P show]
ATA Version is:   ATA8-ACS T13/1699-D revision 4
SATA Version is:  SATA 2.6, 3.0 Gb/s
Local Time is:    Thu Feb 23 10:16:24 2023 CET

==> WARNING: A firmware update for this drive may be available,
see the following Seagate web pages:
http://knowledge.seagate.com/articles/en_US/FAQ/207931en
http://knowledge.seagate.com/articles/en_US/FAQ/213891en

SMART support is: Available - device has SMART capability.
SMART support is: Enabled
AAM level is:     0 (vendor specific), recommended: 254
APM feature is:   Unavailable
Rd look-ahead is: Enabled
Write cache is:   Enabled
DSN feature is:   Unavailable
ATA Security is:  Disabled, NOT FROZEN [SEC1]
Wt Cache Reorder: Unknown

=== START OF READ SMART DATA SECTION ===
SMART overall-health self-assessment test result: PASSED

General SMART Values:
Offline data collection status:  (0x82) Offline data collection activity
                                        was completed without error.
                                        Auto Offline Data Collection: Enabled.
Self-test execution status:      (   0) The previous self-test routine completed
                                        without error or no self-test has ever
                                        been run.
Total time to complete Offline
data collection:                (  600) seconds.
Offline data collection
capabilities:                    (0x7b) SMART execute Offline immediate.
                                        Auto Offline data collection on/off supp                                                                                                                                                             ort.
                                        Suspend Offline collection upon new
                                        command.
                                        Offline surface scan supported.
                                        Self-test supported.
                                        Conveyance Self-test supported.
                                        Selective Self-test supported.
SMART capabilities:            (0x0003) Saves SMART data before entering
                                        power-saving mode.
                                        Supports SMART auto save timer.
Error logging capability:        (0x01) Error logging supported.
                                        General Purpose Logging supported.
Short self-test routine
recommended polling time:        (   1) minutes.
Extended self-test routine
recommended polling time:        ( 179) minutes.
Conveyance self-test routine
recommended polling time:        (   2) minutes.
SCT capabilities:              (0x103f) SCT Status supported.
                                        SCT Error Recovery Control supported.
                                        SCT Feature Control supported.
                                        SCT Data Table supported.

SMART Attributes Data Structure revision number: 10
Vendor Specific SMART Attributes with Thresholds:
ID# ATTRIBUTE_NAME          FLAGS    VALUE WORST THRESH FAIL RAW_VALUE
  1 Raw_Read_Error_Rate     POSR--   112   099   006    -    49337459
  3 Spin_Up_Time            PO----   095   095   000    -    0
  4 Start_Stop_Count        -O--CK   091   091   020    -    9397
  5 Reallocated_Sector_Ct   PO--CK   100   100   036    -    0
  7 Seek_Error_Rate         POSR--   073   060   030    -    22550000
  9 Power_On_Hours          -O--CK   093   093   000    -    6516
 10 Spin_Retry_Count        PO--C-   100   100   097    -    0
 12 Power_Cycle_Count       -O--CK   098   098   020    -    2767
183 Runtime_Bad_Block       -O--CK   100   100   000    -    0
184 End-to-End_Error        -O--CK   100   100   099    -    0
187 Reported_Uncorrect      -O--CK   100   100   000    -    0
188 Command_Timeout         -O--CK   100   099   000    -    16
189 High_Fly_Writes         -O-RCK   100   100   000    -    0
190 Airflow_Temperature_Cel -O---K   074   054   045    -    26 (Min/Max 24/33)
194 Temperature_Celsius     -O---K   026   046   000    -    26 (0 12 0 0 0)
195 Hardware_ECC_Recovered  -O-RC-   037   021   000    -    49337459
197 Current_Pending_Sector  -O--C-   100   100   000    -    0
198 Offline_Uncorrectable   ----C-   100   100   000    -    0
199 UDMA_CRC_Error_Count    -OSRCK   200   200   000    -    0
240 Head_Flying_Hours       ------   100   253   000    -    13676 (178 249 0)
241 Total_LBAs_Written      ------   100   253   000    -    1162942342
242 Total_LBAs_Read         ------   100   253   000    -    3719837755
                            ||||||_ K auto-keep
                            |||||__ C event count
                            ||||___ R error rate
                            |||____ S speed/performance
                            ||_____ O updated online
                            |______ P prefailure warning

General Purpose Log Directory Version 1
SMART           Log Directory Version 1 [multi-sector log support]
Address    Access  R/W   Size  Description
0x00       GPL,SL  R/O      1  Log Directory
0x01       GPL,SL  R/O      1  Summary SMART error log
0x02       GPL,SL  R/O      5  Comprehensive SMART error log
0x03       GPL     R/O      5  Ext. Comprehensive SMART error log
0x06       GPL,SL  R/O      1  SMART self-test log
0x07       GPL     R/O      1  Extended self-test log
0x09       GPL,SL  R/W      1  Selective self-test log
0x10       GPL     R/O      1  NCQ Command Error log
0x11       GPL     R/O      1  SATA Phy Event Counters log
0x21       GPL     R/O      1  Write stream error log
0x22       GPL     R/O      1  Read stream error log
0x80-0x9f  GPL,SL  R/W     16  Host vendor specific log
0xa1       GPL,SL  VS      20  Device vendor specific log
0xa2       GPL     VS    2248  Device vendor specific log
0xa8       GPL,SL  VS     129  Device vendor specific log
0xa9       GPL,SL  VS       1  Device vendor specific log
0xb0       GPL     VS    2928  Device vendor specific log
0xbd       GPL     VS     252  Device vendor specific log
0xbe-0xbf  GPL     VS   65535  Device vendor specific log
0xc0       GPL,SL  VS       1  Device vendor specific log
0xe0       GPL,SL  R/W      1  SCT Command/Status
0xe1       GPL,SL  R/W      1  SCT Data Transfer

SMART Extended Comprehensive Error Log Version: 1 (5 sectors)
No Errors Logged

SMART Extended Self-test Log Version: 1 (1 sectors)
Num  Test_Description    Status                  Remaining  LifeTime(hours)  LBA                                                                                                                                                             _of_first_error
# 1  Extended offline    Completed without error       00%      6491         -
# 2  Extended offline    Completed without error       00%      6479         -
# 3  Extended offline    Completed without error       00%      6322         -
# 4  Extended offline    Completed without error       00%      6154         -
# 5  Extended offline    Completed without error       00%      5986         -
# 6  Extended offline    Completed without error       00%      5818         -
# 7  Extended offline    Completed without error       00%      5650         -
# 8  Extended offline    Completed without error       00%      5500         -
# 9  Extended offline    Completed without error       00%      5338         -
#10  Short offline       Completed without error       00%      4737         -
#11  Extended offline    Completed without error       00%      4736         -
#12  Extended offline    Interrupted (host reset)      90%      4612         -
#13  Extended offline    Completed without error       00%      4501         -
#14  Short offline       Completed without error       00%      4449         -
#15  Short offline       Completed without error       00%      3366         -
#16  Short offline       Completed without error       00%      3363         -

SMART Selective self-test log data structure revision number 1
 SPAN  MIN_LBA  MAX_LBA  CURRENT_TEST_STATUS
    1        0        0  Not_testing
    2        0        0  Not_testing
    3        0        0  Not_testing
    4        0        0  Not_testing
    5        0        0  Not_testing
Selective self-test flags (0x0):
  After scanning selected spans, do NOT read-scan remainder of disk.
If Selective self-test is pending on power-up, resume after 0 minute delay.

SCT Status Version:                  3
SCT Version (vendor specific):       522 (0x020a)
Device State:                        Active (0)
Current Temperature:                    26 Celsius
Power Cycle Min/Max Temperature:     24/33 Celsius
Lifetime    Min/Max Temperature:     12/46 Celsius
Under/Over Temperature Limit Count:   0/0

SCT Temperature History Version:     2
Temperature Sampling Period:         1 minute
Temperature Logging Interval:        59 minutes
Min/Max recommended Temperature:     14/55 Celsius
Min/Max Temperature Limit:           10/60 Celsius
Temperature History Size (Index):    128 (104)

Index    Estimated Time   Temperature Celsius
 105    2023-02-18 04:58     ?  -
 106    2023-02-18 05:57    26  *******
 107    2023-02-18 06:56     ?  -
 108    2023-02-18 07:55    27  ********
 109    2023-02-18 08:54     ?  -
 110    2023-02-18 09:53    28  *********
 111    2023-02-18 10:52     ?  -
 112    2023-02-18 11:51    29  **********
 113    2023-02-18 12:50    29  **********
 114    2023-02-18 13:49    37  ******************
 115    2023-02-18 14:48    38  *******************
 116    2023-02-18 15:47    38  *******************
 117    2023-02-18 16:46    34  ***************
 118    2023-02-18 17:45    32  *************
 119    2023-02-18 18:44    37  ******************
 120    2023-02-18 19:43    38  *******************
 121    2023-02-18 20:42    26  *******
 122    2023-02-18 21:41    24  *****
 123    2023-02-18 22:40    25  ******
 124    2023-02-18 23:39    24  *****
 125    2023-02-19 00:38    24  *****
 126    2023-02-19 01:37    26  *******
 127    2023-02-19 02:36    24  *****
   0    2023-02-19 03:35    24  *****
   1    2023-02-19 04:34    25  ******
 ...    ..(  2 skipped).    ..  ******
   4    2023-02-19 07:31    25  ******
   5    2023-02-19 08:30    24  *****
   6    2023-02-19 09:29    24  *****
   7    2023-02-19 10:28    25  ******
 ...    ..(  3 skipped).    ..  ******
  11    2023-02-19 14:24    25  ******
  12    2023-02-19 15:23    32  *************
  13    2023-02-19 16:22    35  ****************
  14    2023-02-19 17:21    36  *****************
  15    2023-02-19 18:20    37  ******************
  16    2023-02-19 19:19    35  ****************
  17    2023-02-19 20:18    37  ******************
 ...    ..(  4 skipped).    ..  ******************
  22    2023-02-20 01:13    37  ******************
  23    2023-02-20 02:12    36  *****************
 ...    ..(  2 skipped).    ..  *****************
  26    2023-02-20 05:09    36  *****************
  27    2023-02-20 06:08    28  *********
  28    2023-02-20 07:07    29  **********
  29    2023-02-20 08:06    26  *******
  30    2023-02-20 09:05    26  *******
  31    2023-02-20 10:04    31  ************
  32    2023-02-20 11:03    28  *********
  33    2023-02-20 12:02     ?  -
  34    2023-02-20 13:01    22  ***
  35    2023-02-20 14:00     ?  -
  36    2023-02-20 14:59    25  ******
  37    2023-02-20 15:58     ?  -
  38    2023-02-20 16:57    30  ***********
  39    2023-02-20 17:56    30  ***********
  40    2023-02-20 18:55    27  ********
  41    2023-02-20 19:54     ?  -
  42    2023-02-20 20:53    33  **************
  43    2023-02-20 21:52     ?  -
  44    2023-02-20 22:51    25  ******
  45    2023-02-20 23:50     ?  -
  46    2023-02-21 00:49    24  *****
  47    2023-02-21 01:48     ?  -
  48    2023-02-21 02:47    27  ********
  49    2023-02-21 03:46    27  ********
  50    2023-02-21 04:45    32  *************
  51    2023-02-21 05:44    35  ****************
 ...    ..(  5 skipped).    ..  ****************
  57    2023-02-21 11:38    35  ****************
  58    2023-02-21 12:37    28  *********
  59    2023-02-21 13:36    25  ******
  60    2023-02-21 14:35    24  *****
 ...    ..(  7 skipped).    ..  *****
  68    2023-02-21 22:27    24  *****
  69    2023-02-21 23:26    31  ************
  70    2023-02-22 00:25    24  *****
  71    2023-02-22 01:24    24  *****
  72    2023-02-22 02:23    24  *****
  73    2023-02-22 03:22    34  ***************
  74    2023-02-22 04:21    35  ****************
  75    2023-02-22 05:20    34  ***************
  76    2023-02-22 06:19    35  ****************
  77    2023-02-22 07:18    35  ****************
  78    2023-02-22 08:17    35  ****************
  79    2023-02-22 09:16    37  ******************
  80    2023-02-22 10:15     ?  -
  81    2023-02-22 11:14    26  *******
  82    2023-02-22 12:13     ?  -
  83    2023-02-22 13:12    34  ***************
  84    2023-02-22 14:11     ?  -
  85    2023-02-22 15:10    31  ************
  86    2023-02-22 16:09     ?  -
  87    2023-02-22 17:08    31  ************
  88    2023-02-22 18:07    31  ************
  89    2023-02-22 19:06    27  ********
  90    2023-02-22 20:05    25  ******
  91    2023-02-22 21:04    24  *****
 ...    ..(  2 skipped).    ..  *****
  94    2023-02-23 00:01    24  *****
  95    2023-02-23 01:00    26  *******
  96    2023-02-23 01:59    25  ******
  97    2023-02-23 02:58    24  *****
 ...    ..(  6 skipped).    ..  *****
 104    2023-02-23 09:51    24  *****

SCT Error Recovery Control:
           Read: Disabled
          Write: Disabled

Device Statistics (GP/SMART Log 0x04) not supported

Pending Defects log (GP Log 0x0c) not supported

SATA Phy Event Counters (GP Log 0x11)
ID      Size     Value  Description
0x000a  2            4  Device-to-host register FISes sent due to a COMRESET
0x0001  2            0  Command failed due to ICRC error
0x0003  2            0  R_ERR response for device-to-host data FIS
0x0004  2            0  R_ERR response for host-to-device data FIS
0x0006  2            0  R_ERR response for device-to-host non-data FIS
0x0007  2            0  R_ERR response for host-to-device non-data FIS


I suspect you'll need to do something like removing the drive from the pool, secure erasing it, and then adding it back to the pool.
Is this a solution? Or is it something that might work? My pools are raidz1, one of them has 4 drives affected, the other one only has 2 (because the 2 other drives weren't plugged in at the moment of the failed smartctl test). This means i'll need to resilver 4 times a 4*4tb pool, before resilvering twice a 4*1tb one, while both of them are holding some data. Of course I could copy the contents of one pool to the other, wiping everything clean and then create new pools, but how would I be sure that would clear the error?

Since the issue appeared after updating to 22.12.1, I'm pretty sure the version has something to do with it, but I can't find anywhere in the release notes that something was done to smartctl. Maybe "code cleanup" went a bit too far and the system now flags as unhealthy anything with smartctl reports? Should I file a bug report?


Once again, thanks for taking the time to read and help me, I really appreciate it.
 

Attachments

  • Screenshot 2023-02-23 100256.png
    Screenshot 2023-02-23 100256.png
    203.6 KB · Views: 102
Last edited:
Joined
Jun 15, 2022
Messages
674
The S.M.A.R.T. flags do impact the pool status, I've tested this recently by purposefully failing drives under various scenarios to ensure if something happens the TrueNAS User Interface reports it; iXsystems did a great job, the UI will not shut the system down during a long smartctl test, and if smartctl reports even 1 read error the UI will report it. (It will also e-mail the results if so configured.)

The settings are under Settings > Alert Settings > Hardware
under the category S.M.A.R.T. Error the Warning Level and Frequency can be set.
SMART_Warning.png

To immediately run a manual S.M.A.R.T. test use Storage > Disks and select the disks to be tested, then click Manual Test. The short test takes about two minutes and checks a few important areas of the drive. The long test typically runs a short test and then reads the entire drive, checking the results against the encoding checksum. If there is a correctable error the drive may re-write the data then re-read it to see if the new, stronger magnetic field is holding the data, which if it does not the drive will mark the block bad and move the data to a different area.
StorageDisksManualTestOptions.png


S.M.A.R.T. checks can be scheduled with Tasks > S.M.A.R.T. Tests and clicking ADD. Avoid scheduling tests on the same day as a scrub or resilver as each is very disk intensive and will cause a lot of head thrashing (and wear).

To clear the flags on a single device issue the appropriate command from the Command Line Interface (CLI):
zpool clear [pool_name] [device_name]

To clear the flags on all devices in a pool and reset the data error counts to zero, issue a command from the CLI:
zpool clear [pool_name]

The results of either command should be reflected in the TrueNAS User Interface within 5 seconds if the iXsystems setting defaults are in effect; if they've been modified then it depends on what was modified and how, which is why in another thread about overriding system settings outside of the User Interface @jgreco basically said, "Don't do that."
 
Last edited:

NeWizz_

Dabbler
Joined
Feb 12, 2023
Messages
10
The S.M.A.R.T. flags do impact on the pool status, I've tested this recently by purposefully failing drives under various scenarios to ensure if something happens the TrueNAS User Interface reports it; iXsystems did a great job, the UI will not shut the system down during a long smartctl test, and if smartctl reports even 1 read error the UI will report it also. (It will also e-mail the results if so configured.)

The settings are under Settings > Alert Settings > Hardware, under the category S.M.A.R.T. Error the Warning Level and Frequency can be set.
View attachment 63870

To immediately run a manual S.M.A.R.T. test use Storage > Disks and select the disks to be tested, then click Manual Test. The short test takes about two minutes and checks a few important areas of the drive. The long test typically runs a short test and then reads the entire drive, checking the results against the encoding checksum. If there is a correctable error the drive may re-write the data then re-read it to see if the new, stronger magnetic field is holding the data, which if it does not the drive will mark the block bad and move the data to a different area.
StorageDisksManualTestOptions.png


S.M.A.R.T. checks can be scheduled with Tasks > S.M.A.R.T. Tests and clicking ADD. Avoid scheduling tests on the same day as a scrub or resilver as each is very disk intensive and will cause a lot of head thrashing (and wear).

To clear the flags on a single device issue the appropriate command from the Command Line Interface (CLI):
zpool clear [pool_name] [device_name]

To clear the flags on all devices in a pool and reset the data error counts to zero, issue a command from the CLI:
zpool clear [pool_name]

The results of either command should be reflected in the User Interface within 5 seconds if the iXsystems setting defaults are in effect; if they've been modified then it depends on what was modified and how, which is why in another thread about overriding system settings outside of the User Interface @jgreco basically said, "Don't do that."

Thanks for that input. I believe it'll help others who might be having issues setting up smartctl. However, I don't understand in what way much of what you said applies to my issue.

I'm not blaming iXsystems at all for anything that could happen, freeware implies I didn't pay for the software I'm using, and therefore I'm not entitled to complain about anything related to them or the way they decide to handle updates or anything related to their product. When I stated that I might need to open a bug report, it was specific to my issue, also mentioned by @mow4cash, as I'm wondering if it's intended behavior.

I also tried clearing the zpool flags for both the entire pools and each specific drive, that doesn't change the disk health status of my pools, and zfs health is still on the green.


tldr: Smartctl works as intended, the UI does too (I think). The issue is that Scale reports 6 out of my 8 HDDs as 'unhealthy', referring to an aborted smartctl test, which is NOT an issue with the drives. That appeared after updating to the latest version of Scale. I am of course not going to scrap those drives, as they are perfectly fine, and that 'unhealthy' flag seems unintended to me, as it refers to a non-issue with the drives (info level, I don't know of the right terminology). That flag could hide some real issues later on, and I can't find version notes explaining why that appeared.
 
Joined
Jun 15, 2022
Messages
674
[...snip] The issue is that Scale reports 6 out of my 8 HDDs as 'unhealthy', referring to an aborted smartctl test, which is NOT an issue with the drives. That appeared after updating to the latest version of Scale. I am of course not going to scrap those drives, as they are perfectly fine, and that 'unhealthy' flag seems unintended to me, as it refers to a non-issue with the drives (info level, I don't know of the right terminology). That flag could hide some real issues later on, and I can't find version notes explaining why that appeared.
Try running a long test to completion; smartctl -a will tell you how long it should take.
 

NeWizz_

Dabbler
Joined
Feb 12, 2023
Messages
10
Try running a long test to completion; smartctl -a will tell you how long it should take.
I already did, as stated in my first post, ran long and even offline tests. The issue picked up by the ui has been there for many weeks. The flag in the ui used to be aborted or something alike, and now has gone to failed, even though the aborted test took place a few weeks ago.
 
Joined
Jun 15, 2022
Messages
674
Good to know, I wasn't clear on exactly what happened (especially given your results), though I am now, thank you.

I'm not seeing anything I'd find suspicious in your logs...maybe it is due to the upgrade, your situation is curious.
 

Samuel Tai

Never underestimate your own stupidity
Moderator
Joined
Apr 24, 2020
Messages
5,399
Is this a solution? Or is it something that might work?

Ordinarily, the SMART test log is write-protected. The only thing that might clear it is a secure erase to reset it to factory. This is more a hunch than a certainty.
 
Joined
Jun 15, 2022
Messages
674
Ordinarily, the SMART test log is write-protected. The only thing that might clear it is a secure erase to reset it to factory. This is more a hunch than a certainty.
Sometimes a command line SCSI format command (issued to the drive, not the OS) will clear the counters and do a reset, format the drive (write/verify), and then set the counters to the result of the format, INCLUDING POWER-ON TIME. Your outcome will vary depending on vendor and the drive's BIOS version. I don't know that's really a good solution to this issue as it wipes out a bunch of history (like the bad-block_replacement table*) and is more of a work-around, but for reference in relation to your comment a format can sometimes do what you're describing.

DISCLAIMER: ALL DATA ON THE DRIVE WILL BE ERASED. THIS COULD LEAD TO TOTAL LOSS OF DATA IF THE POOL EXPERIENCES ISSUES. If you decide this is a viable option the drive should be removed from the pool via the TrueNAS UI, off-lined, and then tinkered with. The most common problems seem to be:
  1. A drive is removed from the pool, off-lined, and the format command is issued to a different drive at which point the pool fails spectacularly.
  2. The format is done properly, but during the resilver a drive decides to fail, and shortly thereafter a second drive decides it's overworked and exits the workforce--but not before throwing a Baby Ruth into the pool just to spite you, because that's how life works.
Therefore I would suggest following the TrueNAS drive replacement guide and swapping in a new drive, then testing possible solutions in a non-production test rig. (Which, if anyone is curious, is why I'm still testing my build. Well, that and I've been spending an unusual amount of time with the new accounting chick.)

Caddyshack.png

---
*On that note, if the bad-block_replacement table is cleared during format you probably want to run badblocks -w on the drive afterward at least twice (-p 2) to rebuild the bad-block_replacement table (probably more like 4 to 5 times which is 4 write/verify passes per run, so it's going to take a week or so...).
 
Last edited:

danb35

Hall of Famer
Joined
Aug 16, 2011
Messages
15,504
Ordinarily, the SMART test log is write-protected
...which isn't the point. What OP's reporting is that the alert in the GUI (not the pool status; as stated several times in this thread, pool status isn't affected by SMART results) apparently isn't clearing.

Nobody should be talking about removing drives, resilvering them, low-level formatting, or any other such thing--the problem is that an alert won't clear. @mow4cash, I assume you've tried clicking the Dismiss link under that alert?
 

NeWizz_

Dabbler
Joined
Feb 12, 2023
Messages
10
...which isn't the point. What OP's reporting is that the alert in the GUI (not the pool status; as stated several times in this thread, pool status isn't affected by SMART results) apparently isn't clearing.

Nobody should be talking about removing drives, resilvering them, low-level formatting, or any other such thing--the problem is that an alert won't clear. @mow4cash, I assume you've tried clicking the Dismiss link under that alert?
Thanks, that's exactly it. I'm fairly new to this community and 'advanced' tinkering with computers as a whole, but I know a thing or two still. I don't want to appear douchey or unthankful for the advice offered, but I'm absolutely certain my drives aren't the issue, as I stated already twice.

Of course, I could nuke the S.M.A.R.T data off my drives, I even have the ability and required hardware in order to do so the proper way, I just don't see a need, nor want to do this. At this point, I'm 100% certain the issue is with the UI, and not with the drives, as I pulled them out in order to check on another system.

I'm however worried that the issue is really an important one, and I'm not sure it's specific to my system. A misidentified 'unhealthy' drive is a sure way to actually miss a real failure, and therefore should be addressed unless that's intended behavior, and I'm not getting it at all.


I'm not seeing anything I'd find suspicious in your logs...maybe it is due to the upgrade, your situation is curious.
The situation is indeed curious, I for one had a strange facial expression when I first saw it, and acknowledged it was affecting 80% of my server (yes I know why, and I'll be happy to explain if needed). Thanks for the input tho, I'm glad you're trying to help me as I was feeling a bit alone against the machine tbh...

I'll let the thread run for a couple more days, maybe someone at iXsystems will pick it up, otherwise, I'll file a bug report through the proper channels. Thanks again for the help and advice guys!
 

danb35

Hall of Famer
Joined
Aug 16, 2011
Messages
15,504
At this point, I'm 100% certain the issue is with the UI, and not with the drives, as I pulled them out in order to check on another system.
Can you post a screen shot of what you're seeing as the problem?
 

NeWizz_

Dabbler
Joined
Feb 12, 2023
Messages
10
Can you post a screen shot of what you're seeing as the problem?

I'll attach multiple screenshots and a full smartctl log, in which I'll try to highlight the non-issue the ui reports as one.

So first the dashboard: everything is fine, notice how every single pool has 0 errors.
dashboard.png


Then the storage dashboard, notice the 'unhealthy' tag and associated warning:
storage.png


then the smartctl reports as per the UI, I'll attach two images as to emphacize on the fact that the issue appeared with the update to 22.12.1 (would have spotted it 100s of hours ago other way), you can figure out how they are dated according to the drives service hours:
smart tests 1.png

smart tests 2.png


Notice how the UI mentions the test as 'Failed' at 177 hours, while it was actually aborted, as per the following smartctl report:
Code:
=== START OF INFORMATION SECTION ===
Device Model:     ST4000VN006-3CW104
Serial Number:    ZW60347M
LU WWN Device Id: 5 000c50 0e51dbb57
Firmware Version: SC60
User Capacity:    4,000,787,030,016 bytes [4.00 TB]
Sector Sizes:     512 bytes logical, 4096 bytes physical
Rotation Rate:    5400 rpm
Form Factor:      3.5 inches
Device is:        Not in smartctl database [for details use: -P showall]
ATA Version is:   ACS-3 T13/2161-D revision 5
SATA Version is:  SATA 3.1, 6.0 Gb/s (current: 6.0 Gb/s)
Local Time is:    Fri Feb 24 00:52:54 2023 CET
SMART support is: Available - device has SMART capability.
SMART support is: Enabled
AAM feature is:   Unavailable
APM feature is:   Unavailable
Rd look-ahead is: Enabled
Write cache is:   Enabled
DSN feature is:   Unavailable
ATA Security is:  Disabled, NOT FROZEN [SEC1]
Wt Cache Reorder: Enabled

=== START OF READ SMART DATA SECTION ===
SMART overall-health self-assessment test result: PASSED

General SMART Values:
Offline data collection status:  (0x00) Offline data collection activity
                                        was never started.
                                        Auto Offline Data Collection: Disabled.
Self-test execution status:      (   0) The previous self-test routine completed
                                        without error or no self-test has ever
                                        been run.
Total time to complete Offline
data collection:                (    0) seconds.
Offline data collection
capabilities:                    (0x73) SMART execute Offline immediate.
                                        Auto Offline data collection on/off supp                                                                                                                                                             ort.
                                        Suspend Offline collection upon new
                                        command.
                                        No Offline surface scan supported.
                                        Self-test supported.
                                        Conveyance Self-test supported.
                                        Selective Self-test supported.
SMART capabilities:            (0x0003) Saves SMART data before entering
                                        power-saving mode.
                                        Supports SMART auto save timer.
Error logging capability:        (0x01) Error logging supported.
                                        General Purpose Logging supported.
Short self-test routine
recommended polling time:        (   1) minutes.
Extended self-test routine
recommended polling time:        ( 457) minutes.
Conveyance self-test routine
recommended polling time:        (   2) minutes.
SCT capabilities:              (0x70bd) SCT Status supported.
                                        SCT Error Recovery Control supported.
                                        SCT Feature Control supported.
                                        SCT Data Table supported.

SMART Attributes Data Structure revision number: 10
Vendor Specific SMART Attributes with Thresholds:
ID# ATTRIBUTE_NAME          FLAGS    VALUE WORST THRESH FAIL RAW_VALUE
  1 Raw_Read_Error_Rate     POSR--   080   064   006    -    92199524
  3 Spin_Up_Time            PO----   096   096   000    -    0
  4 Start_Stop_Count        -O--CK   098   098   020    -    2332
  5 Reallocated_Sector_Ct   PO--CK   100   100   010    -    0
  7 Seek_Error_Rate         POSR--   074   060   045    -    22625841
  9 Power_On_Hours          -O--CK   099   099   000    -    1224
 10 Spin_Retry_Count        PO--C-   100   100   097    -    0
 12 Power_Cycle_Count       -O--CK   100   100   020    -    23
183 Runtime_Bad_Block       -O--CK   100   100   000    -    0
184 End-to-End_Error        -O--CK   100   100   099    -    0
187 Reported_Uncorrect      -O--CK   100   100   000    -    0
188 Command_Timeout         -O--CK   100   100   000    -    0
189 High_Fly_Writes         -O-RCK   100   100   000    -    0
190 Airflow_Temperature_Cel -O---K   069   060   040    -    31 (Min/Max 26/31)
191 G-Sense_Error_Rate      -O--CK   100   100   000    -    0
192 Power-Off_Retract_Count -O--CK   100   100   000    -    23
193 Load_Cycle_Count        -O--CK   099   099   000    -    2331
194 Temperature_Celsius     -O---K   031   040   000    -    31 (0 24 0 0 0)
195 Hardware_ECC_Recovered  -O-RC-   080   064   000    -    92199524
197 Current_Pending_Sector  -O--C-   100   100   000    -    0
198 Offline_Uncorrectable   ----C-   100   100   000    -    0
199 UDMA_CRC_Error_Count    -OSRCK   200   200   000    -    0
240 Head_Flying_Hours       ------   100   253   000    -    299 (107 39 0)
241 Total_LBAs_Written      ------   100   253   000    -    1927851385
242 Total_LBAs_Read         ------   100   253   000    -    5168526390
                            ||||||_ K auto-keep
                            |||||__ C event count
                            ||||___ R error rate
                            |||____ S speed/performance
                            ||_____ O updated online
                            |______ P prefailure warning

General Purpose Log Directory Version 1
SMART           Log Directory Version 1 [multi-sector log support]
Address    Access  R/W   Size  Description
0x00       GPL,SL  R/O      1  Log Directory
0x01           SL  R/O      1  Summary SMART error log
0x02           SL  R/O      5  Comprehensive SMART error log
0x03       GPL     R/O      5  Ext. Comprehensive SMART error log
0x04       GPL,SL  R/O      8  Device Statistics log
0x06           SL  R/O      1  SMART self-test log
0x07       GPL     R/O      1  Extended self-test log
0x08       GPL     R/O      2  Power Conditions log
0x09           SL  R/W      1  Selective self-test log
0x0c       GPL     R/O   2048  Pending Defects log
0x10       GPL     R/O      1  NCQ Command Error log
0x11       GPL     R/O      1  SATA Phy Event Counters log
0x21       GPL     R/O      1  Write stream error log
0x22       GPL     R/O      1  Read stream error log
0x24       GPL     R/O    512  Current Device Internal Status Data log
0x30       GPL,SL  R/O      9  IDENTIFY DEVICE data log
0x80-0x9f  GPL,SL  R/W     16  Host vendor specific log
0xa1       GPL,SL  VS      24  Device vendor specific log
0xa2       GPL     VS    8160  Device vendor specific log
0xa6       GPL     VS     192  Device vendor specific log
0xa8-0xa9  GPL,SL  VS     136  Device vendor specific log
0xab       GPL     VS       1  Device vendor specific log
0xb0       GPL     VS    9048  Device vendor specific log
0xbe-0xbf  GPL     VS   65535  Device vendor specific log
0xc0       GPL,SL  VS       1  Device vendor specific log
0xc1       GPL,SL  VS      16  Device vendor specific log
0xc3       GPL,SL  VS       8  Device vendor specific log
0xc4       GPL,SL  VS      24  Device vendor specific log
0xd1       GPL     VS     264  Device vendor specific log
0xd3       GPL     VS    1920  Device vendor specific log
0xe0       GPL,SL  R/W      1  SCT Command/Status
0xe1       GPL,SL  R/W      1  SCT Data Transfer

SMART Extended Comprehensive Error Log Version: 1 (5 sectors)
No Errors Logged

SMART Extended Self-test Log Version: 1 (1 sectors)
Num  Test_Description    Status                  Remaining  LifeTime(hours)  LBA                                                                                                                                                             _of_first_error
# 1  Extended offline    Completed without error       00%      1188         -
# 2  Extended offline    Completed without error       00%      1176         -
# 3  Extended offline    Completed without error       00%      1020         -
# 4  Extended offline    Completed without error       00%       852         -
# 5  Extended offline    Completed without error       00%       684         -
# 6  Extended offline    Completed without error       00%       516         -
# 7  Extended offline    Completed without error       00%       348         -
# 8  Extended offline    Interrupted (host reset)      00%       177         -
# 9  Extended offline    Completed without error       00%        28         -
#10  Extended offline    Completed without error       00%        13         -

SMART Selective self-test log data structure revision number 1
 SPAN  MIN_LBA  MAX_LBA  CURRENT_TEST_STATUS
    1        0        0  Not_testing
    2        0        0  Not_testing
    3        0        0  Not_testing
    4        0        0  Not_testing
    5        0        0  Not_testing
Selective self-test flags (0x0):
  After scanning selected spans, do NOT read-scan remainder of disk.
If Selective self-test is pending on power-up, resume after 0 minute delay.

SCT Status Version:                  3
SCT Version (vendor specific):       522 (0x020a)
Device State:                        Active (0)
Current Temperature:                    30 Celsius
Power Cycle Min/Max Temperature:     26/32 Celsius
Lifetime    Min/Max Temperature:     24/40 Celsius
Under/Over Temperature Limit Count:   0/0

SCT Temperature History Version:     2
Temperature Sampling Period:         3 minutes
Temperature Logging Interval:        94 minutes
Min/Max recommended Temperature:      1/61 Celsius
Min/Max Temperature Limit:            2/60 Celsius
Temperature History Size (Index):    128 (25)

Index    Estimated Time   Temperature Celsius
  26    2023-02-15 17:32    28  *********
 ...    ..(  2 skipped).    ..  *********
  29    2023-02-15 22:14    28  *********
  30    2023-02-15 23:48    29  **********
 ...    ..(  2 skipped).    ..  **********
  33    2023-02-16 04:30    29  **********
  34    2023-02-16 06:04    28  *********
  35    2023-02-16 07:38    29  **********
 ...    ..(  2 skipped).    ..  **********
  38    2023-02-16 12:20    29  **********
  39    2023-02-16 13:54    28  *********
  40    2023-02-16 15:28    30  ***********
  41    2023-02-16 17:02    30  ***********
  42    2023-02-16 18:36    29  **********
  43    2023-02-16 20:10    29  **********
  44    2023-02-16 21:44    29  **********
  45    2023-02-16 23:18    30  ***********
  46    2023-02-17 00:52    30  ***********
  47    2023-02-17 02:26    30  ***********
  48    2023-02-17 04:00    29  **********
  49    2023-02-17 05:34    29  **********
  50    2023-02-17 07:08    30  ***********
  51    2023-02-17 08:42    30  ***********
  52    2023-02-17 10:16    29  **********
 ...    ..(  2 skipped).    ..  **********
  55    2023-02-17 14:58    29  **********
  56    2023-02-17 16:32    30  ***********
  57    2023-02-17 18:06    30  ***********
  58    2023-02-17 19:40    29  **********
  59    2023-02-17 21:14    29  **********
  60    2023-02-17 22:48    30  ***********
  61    2023-02-18 00:22    30  ***********
  62    2023-02-18 01:56    29  **********
  63    2023-02-18 03:30    40  *********************
  64    2023-02-18 05:04    29  **********
  65    2023-02-18 06:38    30  ***********
  66    2023-02-18 08:12    30  ***********
  67    2023-02-18 09:46    29  **********
  68    2023-02-18 11:20    29  **********
  69    2023-02-18 12:54    28  *********
  70    2023-02-18 14:28    30  ***********
  71    2023-02-18 16:02    30  ***********
  72    2023-02-18 17:36    29  **********
  73    2023-02-18 19:10    29  **********
  74    2023-02-18 20:44    29  **********
  75    2023-02-18 22:18    30  ***********
  76    2023-02-18 23:52    30  ***********
  77    2023-02-19 01:26    29  **********
  78    2023-02-19 03:00    29  **********
  79    2023-02-19 04:34    28  *********
  80    2023-02-19 06:08    27  ********
  81    2023-02-19 07:42    28  *********
  82    2023-02-19 09:16    28  *********
  83    2023-02-19 10:50    27  ********
  84    2023-02-19 12:24    27  ********
  85    2023-02-19 13:58    27  ********
  86    2023-02-19 15:32    28  *********
  87    2023-02-19 17:06    29  **********
  88    2023-02-19 18:40    28  *********
  89    2023-02-19 20:14    28  *********
  90    2023-02-19 21:48    28  *********
  91    2023-02-19 23:22    29  **********
  92    2023-02-20 00:56    29  **********
  93    2023-02-20 02:30    28  *********
  94    2023-02-20 04:04    27  ********
  95    2023-02-20 05:38    27  ********
  96    2023-02-20 07:12    27  ********
  97    2023-02-20 08:46    28  *********
  98    2023-02-20 10:20    27  ********
  99    2023-02-20 11:54    26  *******
 100    2023-02-20 13:28    26  *******
 101    2023-02-20 15:02    26  *******
 102    2023-02-20 16:36    29  **********
 103    2023-02-20 18:10    39  ********************
 104    2023-02-20 19:44    39  ********************
 105    2023-02-20 21:18    38  *******************
 106    2023-02-20 22:52    38  *******************
 107    2023-02-21 00:26    30  ***********
 108    2023-02-21 02:00    29  **********
 109    2023-02-21 03:34    28  *********
 110    2023-02-21 05:08    39  ********************
 111    2023-02-21 06:42    39  ********************
 112    2023-02-21 08:16    39  ********************
 113    2023-02-21 09:50    38  *******************
 114    2023-02-21 11:24    38  *******************
 115    2023-02-21 12:58    28  *********
 116    2023-02-21 14:32    28  *********
 117    2023-02-21 16:06    36  *****************
 118    2023-02-21 17:40     ?  -
 119    2023-02-21 19:14    38  *******************
 120    2023-02-21 20:48     ?  -
 121    2023-02-21 22:22    32  *************
 122    2023-02-21 23:56     ?  -
 123    2023-02-22 01:30    32  *************
 124    2023-02-22 03:04     ?  -
 125    2023-02-22 04:38    29  **********
 126    2023-02-22 06:12     ?  -
 127    2023-02-22 07:46    29  **********
   0    2023-02-22 09:20     ?  -
   1    2023-02-22 10:54    30  ***********
   2    2023-02-22 12:28     ?  -
   3    2023-02-22 14:02    29  **********
   4    2023-02-22 15:36     ?  -
   5    2023-02-22 17:10    30  ***********
   6    2023-02-22 18:44     ?  -
   7    2023-02-22 20:18    30  ***********
   8    2023-02-22 21:52     ?  -
   9    2023-02-22 23:26    31  ************
  10    2023-02-23 01:00     ?  -
  11    2023-02-23 02:34    31  ************
  12    2023-02-23 04:08     ?  -
  13    2023-02-23 05:42    31  ************
  14    2023-02-23 07:16     ?  -
  15    2023-02-23 08:50    31  ************
  16    2023-02-23 10:24     ?  -
  17    2023-02-23 11:58    32  *************
  18    2023-02-23 13:32     ?  -
  19    2023-02-23 15:06    26  *******
  20    2023-02-23 16:40    29  **********
  21    2023-02-23 18:14    30  ***********
  22    2023-02-23 19:48    31  ************
  23    2023-02-23 21:22    30  ***********
  24    2023-02-23 22:56    29  **********
  25    2023-02-24 00:30    29  **********

SCT Error Recovery Control:
           Read: Disabled
          Write: Disabled

Device Statistics (GP Log 0x04)
Page  Offset Size        Value Flags Description
0x01  =====  =               =  ===  == General Statistics (rev 1) ==
0x01  0x008  4              23  ---  Lifetime Power-On Resets
0x01  0x010  4            1224  ---  Power-on Hours
0x01  0x018  6      1927846415  ---  Logical Sectors Written
0x01  0x020  6         4302877  ---  Number of Write Commands
0x01  0x028  6      5168499713  ---  Logical Sectors Read
0x01  0x030  6        11131342  ---  Number of Read Commands
0x01  0x038  6               -  ---  Date and Time TimeStamp
0x03  =====  =               =  ===  == Rotating Media Statistics (rev 1) ==
0x03  0x008  4             299  ---  Spindle Motor Power-on Hours
0x03  0x010  4             299  ---  Head Flying Hours
0x03  0x018  4            2331  ---  Head Load Events
0x03  0x020  4               0  ---  Number of Reallocated Logical Sectors
0x03  0x028  4               0  ---  Read Recovery Attempts
0x03  0x030  4               0  ---  Number of Mechanical Start Failures
0x03  0x038  4               0  ---  Number of Realloc. Candidate Logical Sector                                                                                                                                                             s
0x03  0x040  4              23  ---  Number of High Priority Unload Events
0x04  =====  =               =  ===  == General Errors Statistics (rev 1) ==
0x04  0x008  4               0  ---  Number of Reported Uncorrectable Errors
0x04  0x010  4               0  ---  Resets Between Cmd Acceptance and Completion
0x05  =====  =               =  ===  == Temperature Statistics (rev 1) ==
0x05  0x008  1              30  ---  Current Temperature
0x05  0x010  1              29  ---  Average Short Term Temperature
0x05  0x018  1              27  ---  Average Long Term Temperature
0x05  0x020  1              40  ---  Highest Temperature
0x05  0x028  1              24  ---  Lowest Temperature
0x05  0x030  1              34  ---  Highest Average Short Term Temperature
0x05  0x038  1              25  ---  Lowest Average Short Term Temperature
0x05  0x040  1              27  ---  Highest Average Long Term Temperature
0x05  0x048  1              26  ---  Lowest Average Long Term Temperature
0x05  0x050  4               0  ---  Time in Over-Temperature
0x05  0x058  1              70  ---  Specified Maximum Operating Temperature
0x05  0x060  4               0  ---  Time in Under-Temperature
0x05  0x068  1               0  ---  Specified Minimum Operating Temperature
0x06  =====  =               =  ===  == Transport Statistics (rev 1) ==
0x06  0x008  4              82  ---  Number of Hardware Resets
0x06  0x010  4              40  ---  Number of ASR Events
0x06  0x018  4               0  ---  Number of Interface CRC Errors
                                |||_ C monitored condition met
                                ||__ D supports DSN
                                |___ N normalized value

Pending Defects log (GP Log 0x0c)
No Defects Logged

SATA Phy Event Counters (GP Log 0x11)
ID      Size     Value  Description
0x000a  2            8  Device-to-host register FISes sent due to a COMRESET
0x0001  2            0  Command failed due to ICRC error
0x0003  2            0  R_ERR response for device-to-host data FIS
0x0004  2            0  R_ERR response for host-to-device data FIS
0x0006  2            0  R_ERR response for device-to-host non-data FIS
0x0007  2            0  R_ERR response for host-to-device non-data FIS


The line you are looking for is the following, I'm sorry but I can't figure out how to make it pop inside the code brackets:
# 8 Extended offline Interrupted (host reset) 00% 177


I hope this is what you were asking for. Thanks again, and please feel free to request anything required in order to troubleshoot this issue.
 

danb35

Hall of Famer
Joined
Aug 16, 2011
Messages
15,504
Thanks for the clarification, and it looks like I was also incorrect in assessing the problem--it isn't an alert as such, but it is something similar. I don't think it's wrong, exactly, but it's at a minimum confusing and probably misleading, for two different reasons: (1) "interrupted" isn't the same thing as "failed"--it isn't "success" either, but it certainly doesn't denote a failure; and (2) even if it were a failure, it'd be considered as superseded by subsequent passing tests. I'd say this is a UI bug, and suggest you report it as one. Reporting through the TrueNAS UI will let you automatically attach a debug file, which would be recommended.
 

NeWizz_

Dabbler
Joined
Feb 12, 2023
Messages
10
Reporting through the TrueNAS UI will let you automatically attach a debug file, which would be recommended.
Looks like i’ll be doing that, thanks for really taking the time to read through it all!
 

NugentS

MVP
Joined
Apr 16, 2020
Messages
2,947
Top