Goals:
I copied this code into my prometheus.yml from this guide https://grafana.com/docs/grafana/latest/getting-started/get-started-grafana-prometheus/
But I get this error in the Prometheus web ui

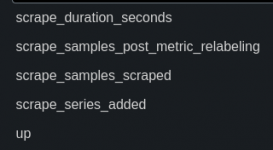
The grafana side of things works just fine, it's able to successfully query the Prometheus API, I've just never been able to get any data into it (other than those 4 useless metrics).
My understanding is you need a data source (node exporter or something else) and a db (Prometheus or influx db). I think I'm failing at the data source part. I thought prometheus came with node exporter installed already, is than not the case or is my prometheus.yml incorrect? Do I just need to install node exporter (or any other exporter) through the TrueNAS shell?
If this is not the best/easiest way to setup what I'm looking for, then I'm totally willing to start over. I don't have a preference on any method, just looking for the simplest way. Also, if this question is outside of the scope of this forum then please let me know where else I should ask for help. Sorry for the long post, thank you!
- Run Grafana on my Truenas server (Done)
- Set up a dashboard in Grafana the displays basic metrics for my Truenas server like cpu usage, temperature, disk usage, etc..
I copied this code into my prometheus.yml from this guide https://grafana.com/docs/grafana/latest/getting-started/get-started-grafana-prometheus/
# A scrape configuration containing exactly one endpoint to scrape from node_exporter running on a host:
scrape_configs:
# The job name is added as a label `job=<job_name>` to any timeseries scraped from this config.
- job_name: 'node'
# metrics_path defaults to '/metrics'
# scheme defaults to 'http'.
static_configs:
- targets: ['localhost:9100']
But I get this error in the Prometheus web ui
The grafana side of things works just fine, it's able to successfully query the Prometheus API, I've just never been able to get any data into it (other than those 4 useless metrics).
My understanding is you need a data source (node exporter or something else) and a db (Prometheus or influx db). I think I'm failing at the data source part. I thought prometheus came with node exporter installed already, is than not the case or is my prometheus.yml incorrect? Do I just need to install node exporter (or any other exporter) through the TrueNAS shell?
If this is not the best/easiest way to setup what I'm looking for, then I'm totally willing to start over. I don't have a preference on any method, just looking for the simplest way. Also, if this question is outside of the scope of this forum then please let me know where else I should ask for help. Sorry for the long post, thank you!