TrueNAS Documentation Archive
This content follows the TrueNAS 23.10 (Cobia) releases. Archival documentation is provided for reference only and not actively maintained. Use the Product and Version selectors above to view content specific to different TrueNAS software or major version.
Reporting
2 minute read.
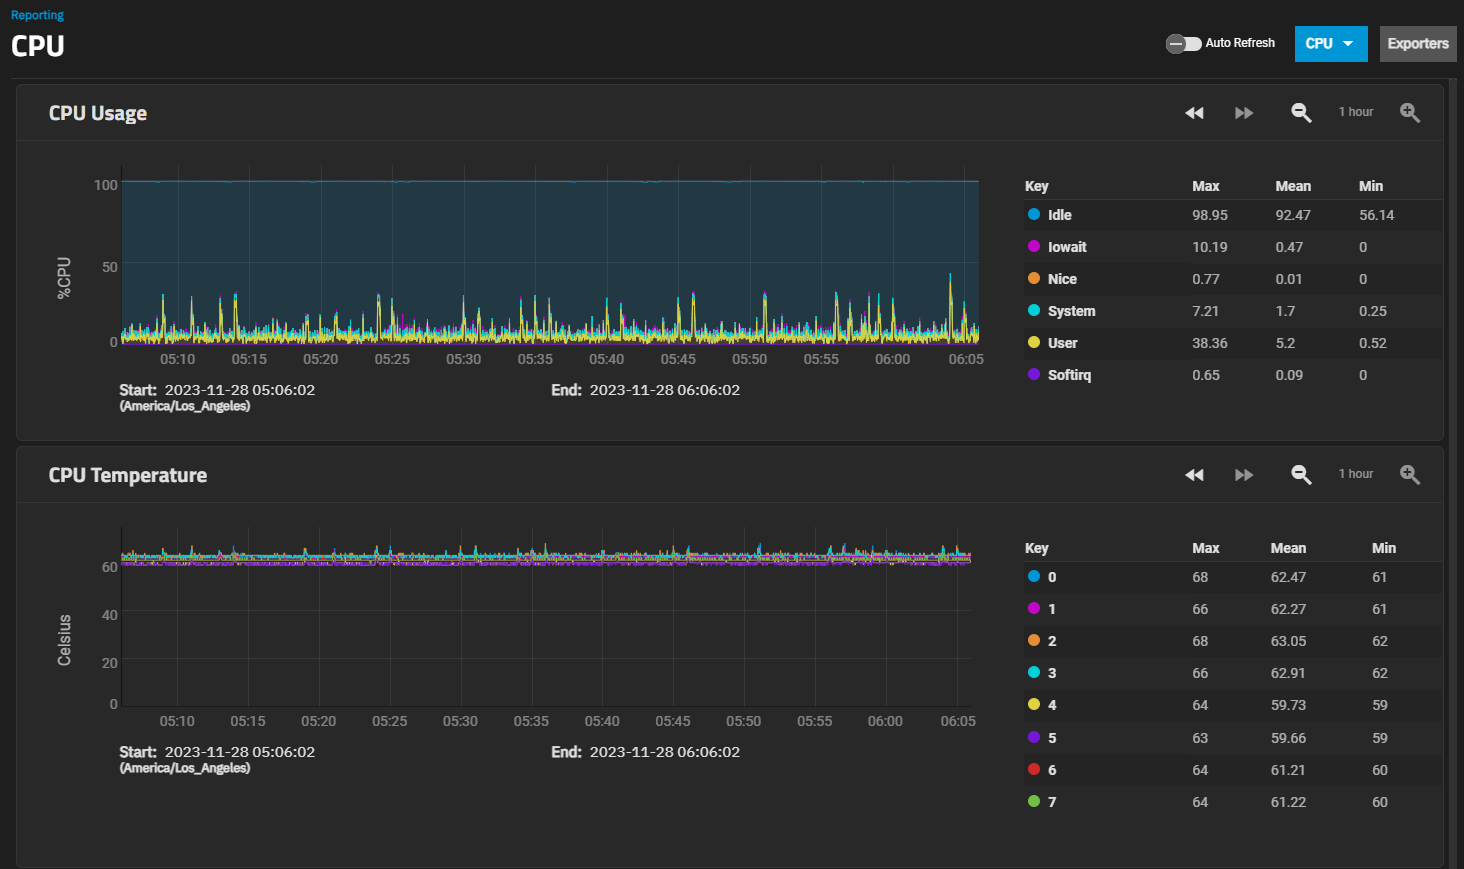
Last Modified 2024-04-24 14:31 EDTTrueNAS has a built-in reporting engine that provides helpful graphs and information about the system.
Reporting data is saved to permit viewing and monitoring usage trends over time. This data is preserved across system upgrades and restarts.
To increase TrueNAS reporting functionality connect it to our TrueCommand multi-system management software.
TrueCommand offers enhanced features for reporting like creating custom graphs and comparing utilization across multiple systems.
Click on and drag a certain range of the graph to expand the information displayed in that selected area in the Graph. Click on the icon to zoom in on the graph. Click on the icon to zoom out on the graph. Click the to move the graph forward. Click the to move the graph backward.
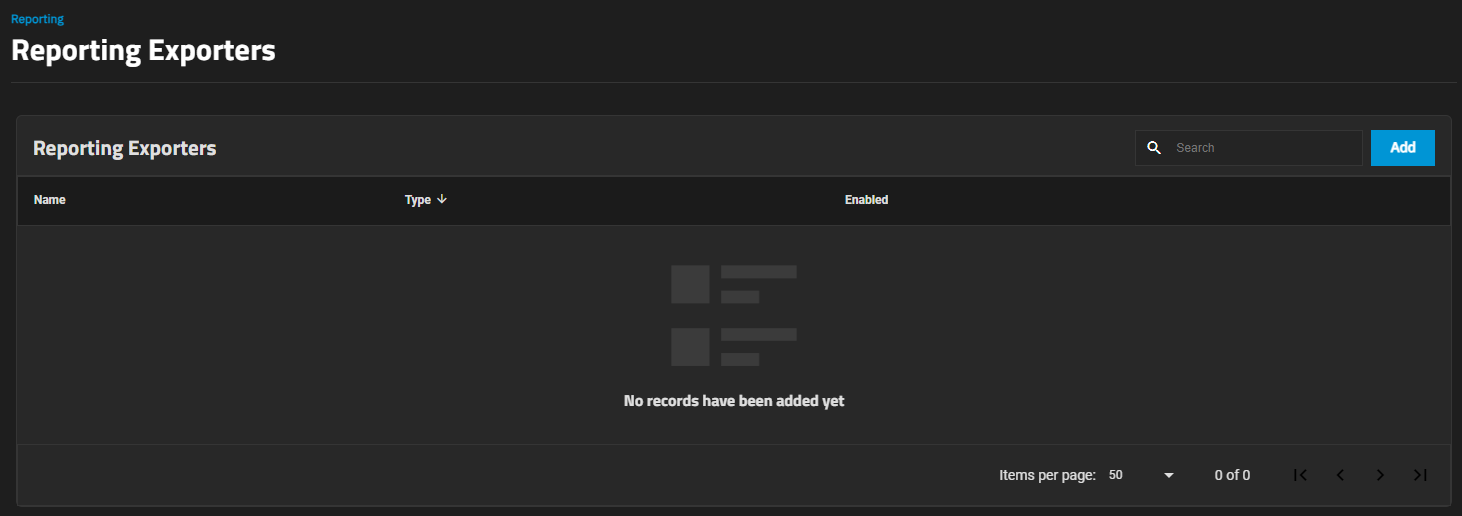
Click Exporters to open the Reporting Exporters screen. The Reporting Exporters screen displays any configured third party reporting exports on the system.
Exporting enables TrueNAS SCALE to send Netdata reporting metrics to another time-series database. For more information, see the Netdata exporting reference guide.
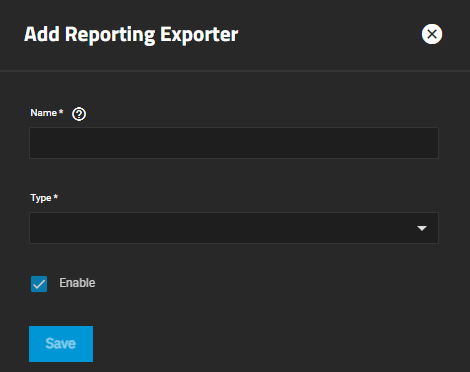
Click Add to open the Add Reporting Exporter screen and configure a third party reporting integration.
Enter a unique name for the exporter configuration in Name. If configuring multiple exporter instances, give each a distinct name.
Select the target database from Type. Graphite is the only current supported option. Additional settings fields automatically populate to configure the selected exporter type.
Select Enable to send reporting metrics to the configured exporter instance. Leave the checkbox cleared to disable the exporter without removing configuration.
Graphite is a monitoring tool that stores and renders time-series data based on a plaintext database. Netdata exports reporting metrics to Graphite in the format prefix.hostname.chart.dimension.
To send reporting data to Graphite, select GRAPHITE in Type.
Enter the IP address of the Graphite server in Destination Ip. Enter the port number the Graphite server monitors in Destination Port.
You can accept the defaults for all other settings, or enter configuration settings to match your use case.
See “Graphite Settings” in Add Reporting Exporter for default values. For additional information, see the Netdata Graphite exporting guide.


