Metrics from TrueNAS Scale server into grafana

hamiltonl

Cadet
Joined
Jan 21, 2024
Messages
5
Goals:
  1. Run Grafana on my Truenas server (Done)
  2. Set up a dashboard in Grafana the displays basic metrics for my Truenas server like cpu usage, temperature, disk usage, etc..
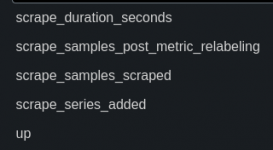
I am having a lot of trouble with this setup. I have done a lot of searching around and have found multiple guides that all seem to go over my head. I'm looking for some help to point me in the right direction. I don't have a preference between influx db or prometheus, those are just the two main data sources I've seen mentioned. Prometheus has a docker image available with charts so that makes it a little easier. I've tried setting that up with the node exporter but only get 4 metrics that don't seem to do anything (See attachment). I've heard you can use a graphite exporter for truenas systems but I don't know how to install that or set that up.

I copied this code into my prometheus.yml from this guide https://grafana.com/docs/grafana/latest/getting-started/get-started-grafana-prometheus/
# A scrape configuration containing exactly one endpoint to scrape from node_exporter running on a host:
scrape_configs:
# The job name is added as a label `job=<job_name>` to any timeseries scraped from this config.
- job_name: 'node'

# metrics_path defaults to '/metrics'
# scheme defaults to 'http'.

static_configs:
- targets: ['localhost:9100']

But I get this error in the Prometheus web ui
1705906498561.png


The grafana side of things works just fine, it's able to successfully query the Prometheus API, I've just never been able to get any data into it (other than those 4 useless metrics).

My understanding is you need a data source (node exporter or something else) and a db (Prometheus or influx db). I think I'm failing at the data source part. I thought prometheus came with node exporter installed already, is than not the case or is my prometheus.yml incorrect? Do I just need to install node exporter (or any other exporter) through the TrueNAS shell?

If this is not the best/easiest way to setup what I'm looking for, then I'm totally willing to start over. I don't have a preference on any method, just looking for the simplest way. Also, if this question is outside of the scope of this forum then please let me know where else I should ask for help. Sorry for the long post, thank you!
 

Attachments

  • Screenshot from 2024-01-22 01-02-46.png
    Screenshot from 2024-01-22 01-02-46.png
    15.3 KB · Views: 119

LarsR

Guru
Joined
Oct 23, 2020
Messages
719
you dont have to install anything to use graphite, it's installed by default. Go to Reporting and in the top right corner of the screen should be a button called exporters. There you can add a graphite exporter.
 

chuck32

Guru
Joined
Jan 14, 2023
Messages
623
Using this this post as a starting point, I also followed the route: TrueNAS=<Graphite>=>Telegraf=>InfluxDB2=>Grafana

My solution is: TrueNAS=<Graphite>=>Telegraf=>InfluxDB2=>Grafana
Some parts of @ray1ex configuration are modified from defaults. So you need to adapt it to your needs.

Under /ui/reportsdashboard/exporters set up the exporter with port 8094

my telegraf.conf
Code:
[[outputs.influxdb_v2]]
  ## The URLs of the InfluxDB cluster nodes.
  urls = ["IP OF YOU INFLUXD INSTANCE"]


  ## API token for authentication.
  token = "YOUR API TOKEN"


  ## Organization is the name of the organization you wish to write to; must exist.
  organization = "homelab"


  ## Destination bucket to write into.
  bucket = "truenas-scale"


# Generic socket listener capable of handling multiple socket types.
[[inputs.socket_listener]]
  ## URL to listen on
  service_address = "tcp://:8094"
  #O  service_address = "tcp://:12003"
  ## Data format to consume.
  ## Each data format has its own unique set of configuration options, read
  ## more about them here:
  ## https://github.com/influxdata/telegraf/blob/master/docs/DATA_FORMATS_INPUT.md
  # data_format = "influx"
  data_format = "graphite"


  ## Content encoding for message payloads, can be set to "gzip" to or
  ## "identity" to apply no encoding.
  # content_encoding = "identity"


  templates = [
    "os.host.measurement.type.field"
  ]
 

hamiltonl

Cadet
Joined
Jan 21, 2024
Messages
5
you dont have to install anything to use graphite, it's installed by default. Go to Reporting and in the top right corner of the screen should be a button called exporters. There you can add a graphite exporter.
I don't see an "exporters" button, just a "reports config" button. There I can input "Remote Graphite Server Hostname" but I'm not sure what that needs to be? Is that what I'm looking for or am I not seeing the "exporters" button? Thanks.
 

chuck32

Guru
Joined
Jan 14, 2023
Messages
623
Which version of Scale are you running?

On 23.10.1 it's called Exporters, right next to where you choose what reporting section you want to view (CPU, ...).

Remote Graphite Server Hostname reminds of something I've seen in CORE.

If I recall correctly you need to run graphite somewhere, e.g. via docker and put that IP / Hostname there (with the port).
 

hamiltonl

Cadet
Joined
Jan 21, 2024
Messages
5
I don't see an "exporters" button, just a "reports config" button. There I can input "Remote Graphite Server Hostname" but I'm not sure what that needs to be? Is that what I'm looking for or am I not seeing the "exporters" button? Thanks.
Alright, my super noob mistake. After looking around I realized I wasn't on the most recent Cobia release that has the exporters button instead of what I was seeing. I upgraded and now see the button to add exporters. I added a graphite exporter but now I'm not sure about how to setup the graphite server to send the data to. Can I do that in prometheus or do I need to use telegraph and influx db? This is the guide I referenced once I realized I was not on the current version: https://www.truenas.com/docs/scale/23.10/scaletutorials/configreportsscale/
 

hamiltonl

Cadet
Joined
Jan 21, 2024
Messages
5
Which version of Scale are you running?

On 23.10.1 it's called Exporters, right next to where you choose what reporting section you want to view (CPU, ...).

Remote Graphite Server Hostname reminds of something I've seen in CORE.

If I recall correctly you need to run graphite somewhere, e.g. via docker and put that IP / Hostname there (with the port).
Thank you, Yep I was running Bluefin instead of Cobia, I learned about trains and now I'm on the current version. I'll try to spin up a docker image for graphite.
 

chuck32

Guru
Joined
Jan 14, 2023
Messages
623
It's been a while since I set it up. You do not need a graphite container if you upgraded.

1705960351775.png

To clarify: the IP is the IP of the docker container running telegraf and the port is 8094 in this example / my config. It's what you open in the docker compose for telegraf and specify in the .conf

docker-compose for telegraf:

Code:
version: "2"
services:
  telegraf:
    image: telegraf:1.29
    container_name: telegraf
    volumes:
      # Make sure you create this local directory
      - /docker/telegraf/telegraf.conf:/etc/telegraf/telegraf.conf
    restart: unless-stopped
    ports:
      - 8125:8125 # I could probably close that one
      - 8094:8094
      - 8092:8092 # and that one
     
# I removed the network section, if I remember correctly docker will setup a default network then


I linked my telegraf.conf above.

It's been some time, but if I remember correctly you need to setup influxdb first. Create a bucket and get an API token for that one. These info is needed for the telegraf.conf

This should be a working docker-compose for influxdb (I removed everything related to traefik)

Code:
---
volumes:
  influxdb-data:
 
services:
  influxdb:
    container_name: influxdb
    image: influxdb:2.7.1-alpine
    ports:
      - '8086:8086'
    volumes:
      - influxdb-data:/var/lib/influxdb2
      - /etc/influxdb2:/etc/influxdb2
    environment:
      - DOCKER_INFLUXDB_INIT_RETENTION=160w 

I'm not 100 % but if you don't specify anything else you should be able to setup your user when you first access influxdb. Otherwise you need to confron the documentation.

Hope this gives you a head start.
 

Patrick M. Hausen

Hall of Famer
Joined
Nov 25, 2013
Messages
7,776
Doesn't Influx 2 have a native Graphite plain text connector so you need Telegraf? Influx 1 does.
 

chuck32

Guru
Joined
Jan 14, 2023
Messages
623
They also dropped graphite in influxdb2 unfortunately.
 

chuck32

Guru
Joined
Jan 14, 2023
Messages
623
Yes, but I solved the data format conversion problem with Telegraf.
Yes indeed! The question was, I assume @Patrick M. Hausen works with influxdb1, why you and I suggested the use of telegraf with influxdb2.

Thank you again, your post was a great starting point to finally get it working for me. Wasn't able before and then for the time being the feature wasn't available in scale anyway.
 

ray1ex

Dabbler
Joined
Aug 16, 2023
Messages
13
Yes indeed! The question was, I assume @Patrick M. Hausen works with influxdb1, why you and I suggested the use of telegraf with influxdb2.

Thank you again, your post was a great starting point to finally get it working for me. Wasn't able before and then for the time being the feature wasn't available in scale anyway.
This Grafana dashboard might work with InfluxDB1, I'm not sure, I'm not familiar with InfluxDB1! Also, I suggest @hamiltonl to upgrade truenas.
 

ray1ex

Dabbler
Joined
Aug 16, 2023
Messages
13

hamiltonl

Cadet
Joined
Jan 21, 2024
Messages
5
Thank you for all the messages and info here! Sorry I'm late to respond, I will try out some of these suggestions tomorrow (or technically today) and get back to you all with how it goes.
 
Top