How To Expose Data For Prometheus?

isopropyl

Contributor
Joined
Jan 29, 2022
Messages
159
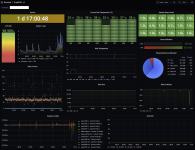
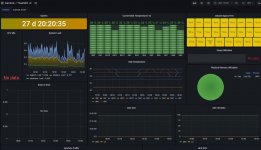
I currently have Prometheus (+node_exporter), Netdata, and Grafana setup in a Jail on TrueNAS. (In the future I plan to put this container on it's own server).
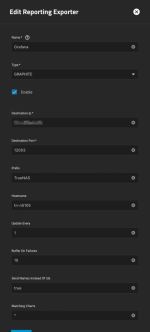
My question is, how exactly do I expose the data of the TrueNAS host to Prometheus (and Netdata) for metrics/logging purposes into Grafana.

Currently, I have node_exporter running in that Jail, but that only grabs the metrics for that Jail. Not the TrueNAS host.

Please bare with me as I am new to using all of this software, and still learning. I have looked around, and searched the forums. I saw someone mention to expose devfs. It was a post from 4 years ago, so I am not sure if that is still relevant, secure, or proper. There was not much more conversation about it, so I am still even confused on how exactly you would do that. I see devfs under Jail properties is currently set to 4. Do I just change that number (to what?) and restart the jail?

Furthermore, would it be possible to grab information such as VDEV info, alerts, SMART data, etc? I presume node_exporter doesn't collect this info, however I am not entirely sure.
Thank you.
 

isopropyl

Contributor
Joined
Jan 29, 2022
Messages
159
I was not
 
Joined
Sep 9, 2022
Messages
1
The metrics are exposed via Graphite. All that you need is a Prometheus endpoint to capture these metrics. This is where you can spin up a graphite-exporter or influxdb-exporter container somewhere on your network. Then just point TrueNAS to this endpoint and now your metrics can be scraped by Prometheus.

If you look in the GUI under system > reporting you can enter the IP address of your graphite-exporter container, and TrueNAS will start sending the metrics to port 2003 on that endpoint.

1662714799864.png


If you are familiar enough with docker you expose the TCP and UDP ports for 9109 on port 2003 to capture the metrics and the exporter will handle the rest.
Code:
docker run -d -p 9108:9108 -p 2003:9109 -p 2003/udp:9109/udp prom/graphite-exporter

To scrape the metrics create a Prometheus job that scrapes this container on port 9108.
Code:
   
 - job_name: truenas
   scrape_interval: 1m
   metrics_path: /metrics
   static_configs:
   - targets:
      - <exporter_ip_address>:9108


I have this setup running inside of a kubernetes cluster that remote writes all of the metrics to cortex. I needed to leverage Prometheus because I require all of my alerting to come from AlertManager.

You'll have to figure out how to make this work with your setup, but I recommend using the container versus running it as a daemon. You can use docker compose to manage the container, and then you don't have to worry about compiling the daemon and creating systemd service file.

I used this dashboard as a template in Grafana, and updated the queries to work with Prometheus instead of InfluxDB.
 

madviper

Cadet
Joined
Sep 20, 2022
Messages
1
The metrics are exposed via Graphite. All that you need is a Prometheus endpoint to capture these metrics. This is where you can spin up a graphite-exporter or influxdb-exporter container somewhere on your network. Then just point TrueNAS to this endpoint and now your metrics can be scraped by Prometheus.

If you look in the GUI under system > reporting you can enter the IP address of your graphite-exporter container, and TrueNAS will start sending the metrics to port 2003 on that endpoint.

View attachment 58312

If you are familiar enough with docker you expose the TCP and UDP ports for 9109 on port 2003 to capture the metrics and the exporter will handle the rest.
Code:
docker run -d -p 9108:9108 -p 2003:9109 -p 2003/udp:9109/udp prom/graphite-exporter

To scrape the metrics create a Prometheus job that scrapes this container on port 9108.
Code:
  
 - job_name: truenas
   scrape_interval: 1m
   metrics_path: /metrics
   static_configs:
   - targets:
      - <exporter_ip_address>:9108


I have this setup running inside of a kubernetes cluster that remote writes all of the metrics to cortex. I needed to leverage Prometheus because I require all of my alerting to come from AlertManager.

You'll have to figure out how to make this work with your setup, but I recommend using the container versus running it as a daemon. You can use docker compose to manage the container, and then you don't have to worry about compiling the daemon and creating systemd service file.

I used this dashboard as a template in Grafana, and updated the queries to work with Prometheus instead of InfluxDB.
Could you provide your JSON version of Dashboard?

Also thank you for your tutorial - I can confirm same thing works on TrueNAS Scale.
 

mazay

Cadet
Joined
Feb 11, 2023
Messages
9
huge thanks to @digital_locust for the guide!
I've deployed graphite-exporter on k8s, added some mappings for having more or less prometheus like metric names and created a dashboard inspired by the linked one. So far so good should be handy for those having multiple TrueNAS instances, will try to put that in a repo and link here later, for now attaching a screenshot.
 

Attachments

  • Screenshot 2023-02-14 at 10.10.42.png
    Screenshot 2023-02-14 at 10.10.42.png
    1.1 MB · Views: 1,509

clabretro

Cadet
Joined
Feb 28, 2023
Messages
2
huge thanks to @digital_locust for the guide!
I've deployed graphite-exporter on k8s, added some mappings for having more or less prometheus like metric names and created a dashboard inspired by the linked one. So far so good should be handy for those having multiple TrueNAS instances, will try to put that in a repo and link here later, for now attaching a screenshot.
Just barely got this working as well, would love to see the dashboard JSON!
 

gauthig

Cadet
Joined
Sep 10, 2022
Messages
5
How can I change the default sending port of graphite stats from 2003 to something like 9003. I installed Influxdb on truenas using the docker apps, but since you can only use ports above 9000, I just need to redirect the graphite output in the reports configuration section.

I added :9003 to the remote graphite server hostname, but that does not work as it still sends it to port 2003.
Solved from another post - clicked the option 'Provide access to node network namespace for the workload' that solved it, using native ports now.
 

clabretro

Cadet
Joined
Feb 28, 2023
Messages
2
ok, that's just a shorthand summary, feel free to use it, file PRs, etc.
Fantastic! I just had to adjust a bit for my mappings (I used these: https://github.com/eagafonov/truenas-graphite-exporter/blob/master/graphite_mapping.conf). Still a work in progress but it was a huge head start, thanks! Progress screenshot attached.

I'm also just running the graphite-exporter on a machine with docker, rather than k8s, here's my docker-compose for anyone interested:
Code:
---
version: "2.1"
services:
  graphite:
    image: prom/graphite-exporter
    container_name: graphite
    command:
      - --graphite.mapping-config=/tmp/graphite_mapping.conf
      - --graphite.listen-address=:2003
        #- --log.level=debug
    volumes:
      - /local/path/to/mapping/graphite_mapping.conf:/tmp/graphite_mapping.conf:ro
    ports:
      - "9108:9180"
      - "2003:2003/tcp"
      - "2003:2003/udp"
    restart: unless-stopped
    network_mode: "host"


--log.level=debug is useful trying to figure out if traffic is getting to the container, graphite-exporter will log incoming lines in debug mode: https://github.com/prometheus/graphite_exporter/blob/master/collector/collector.go#L131
 

Attachments

  • truenas-dashboard.jpg
    truenas-dashboard.jpg
    256 KB · Views: 1,411

shinyShoes

Cadet
Joined
Oct 29, 2023
Messages
4
Thanks god this thread exists. I could finally setup metrics with a fancy dashboard for my nas, even with graphite exporter, prometheus and grafana in different hosts. Thank you all
 

shinyShoes

Cadet
Joined
Oct 29, 2023
Messages
4
now with the exporter working again in version 23.10.1 did anybody found a working dashboard? I have graphite-exporter (output format example: dragonfish_truenas_cpu_core_throttling_cpu0) working and configured in Prometheus, but the dashboard is not working. prefix (dragonfish) and hostname (truenas) seems to be obligatory so maybe a custom config in graphite_mapping.yaml is needed?
 

ray1ex

Dabbler
Joined
Aug 16, 2023
Messages
13
My solution is: TrueNAS=<Graphite>=>Telegraf=>InfluxDB2=>Grafana

In TrueNAS(SCALE-23.10.1):
prefix:TrueNAS
hostname:<default value>

FYI, this is my telegraf.conf

Code:
```toml
[[outputs.influxdb_v2]]
  ## The URLs of the InfluxDB cluster nodes.
  urls = ["http://192.168.1.1:18086"]

  ## API token for authentication.
  token = "$INFLUX_TOKEN"

  ## Organization is the name of the organization you wish to write to; must exist.
  organization = "monitor"

  ## Destination bucket to write into.
  bucket = "truenas-graphite"

# Generic socket listener capable of handling multiple socket types.
[[inputs.socket_listener]]
  ## URL to listen on
  service_address = "tcp://:12003"

   ## Data format to consume.
  ## Each data format has its own unique set of configuration options, read
  ## more about them here:
  ## https://github.com/influxdata/telegraf/blob/master/docs/DATA_FORMATS_INPUT.md
  # data_format = "influx"
  data_format = "graphite"

  ## Content encoding for message payloads, can be set to "gzip" to or
  ## "identity" to apply no encoding.
  # content_encoding = "identity"

  templates = [
    "os.host.measurement.type.field"
  ]
```
 
Top