HeloJunkie
Patron
- Joined
- Oct 15, 2014
- Messages
- 300
This is my primary system 'PlexNAS TrueNAS' server as shown below in my signature running TrueNAS-12.0-U8.1
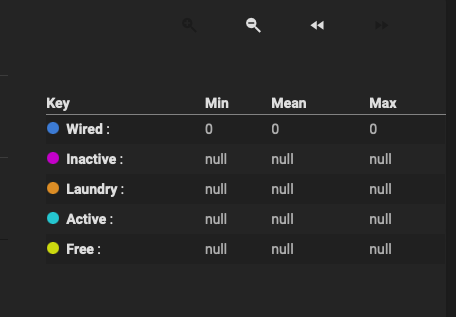
I have read through a bunch of the chrome-related issues where graphs are showing up blank, in my case, I am getting no data at all. I see the graphs (blank), but all values show "null". I have tried Chrome, Firefix, Safari and Brave, this does NOT seem related to the browser issue not being able to show the graphs but rather maybe rrd or something not working correctly.
Part of the backstory - this was a FreeNAS system that I exported the pools, completely reinstalled from scratch with TrueNAS core, and then imported my configuration from my FreeNAS to the TrueNAS core.
I do not have this issue at all on my other TrueNAS (TrueNAS-12.0-U3) system and never had it, regardless of the browser that I was using, my graphs always worked. Rebooting does not fix the issue and the logs don't seem to show anything useful that I can find.
Looking for any advice on how to troubleshoot the issue.
Thanks!
