I have a FN 11.2 u5 setup (is unit in my sig). Its mainly used for NFS -> VMware (3x hosts) , and SMB to VM Guests (and a few physical PCs, as in 3-5x ).
The performance of the entire system has always been great / as expected, but i recently noticed my 280gb Optane 900p (which is used exclusively as a SLOG) has been seeing its wear endurance fall much more quickly than (i feel) it should be. Smart shows 1.57 PB written (i have enterprise HGST ssd drives that have 2PB written and at lower % used). (i realize different IO patterns effect write endurance in different ways tho).
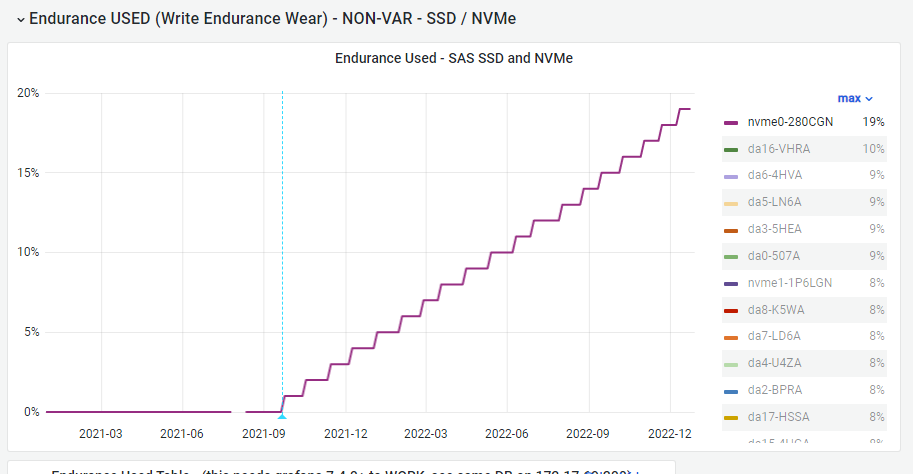
I monitor all smart stats for all disks (every few hours) -> graphite/grafana so its easy to visualize in this 2-year chart:
(no, unfortunately, im not aware of any changes around 2021/09 that could be causing this).

currently:
as well:
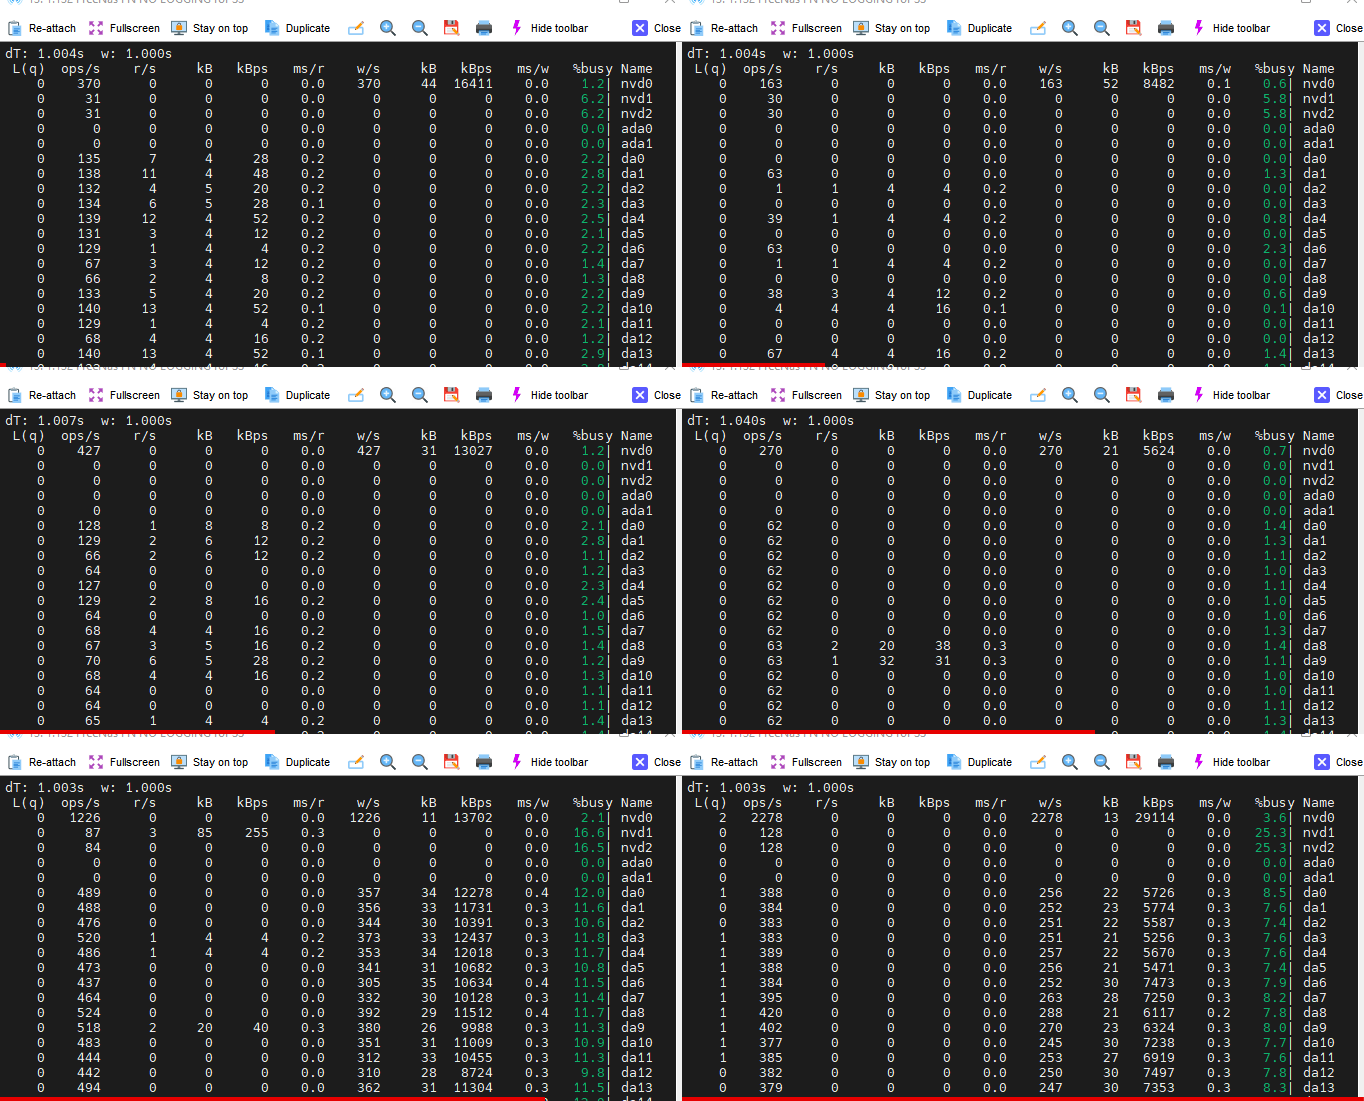
has anyone seen this before? according to gstat there is a small amount of constant write IO going on, but not to the level that i think should be causing the WE to degrade like this.
im also attaching a short animated GIF of gstat, that shows the pretty constant, but low IOPS writting being done to this optane slog (nvd0 is the optane slog).
(in a day or so i will attach the full gstat output of all 64x devices on this machine- but right now im doing a resilver on a z2 pool, 25h remaining, so the gstat data is not typical/relevant)

FreeNAS-11.2-U5
Platform 2x Intel(R) Xeon(R) CPU E5-2637 v2 @ 3.50GHz
Memory 262067MB (ecc)
full smart output of optane:
output of zilstat run (1s intervals):
The performance of the entire system has always been great / as expected, but i recently noticed my 280gb Optane 900p (which is used exclusively as a SLOG) has been seeing its wear endurance fall much more quickly than (i feel) it should be. Smart shows 1.57 PB written (i have enterprise HGST ssd drives that have 2PB written and at lower % used). (i realize different IO patterns effect write endurance in different ways tho).
I monitor all smart stats for all disks (every few hours) -> graphite/grafana so its easy to visualize in this 2-year chart:
(no, unfortunately, im not aware of any changes around 2021/09 that could be causing this).
currently:
Code:
Percentage Used:                    19%
Data Units Read:                    211,160,106 [108 TB]
Data Units Written:                 3,069,275,387 [1.57 PB]
as well:
has anyone seen this before? according to gstat there is a small amount of constant write IO going on, but not to the level that i think should be causing the WE to degrade like this.
im also attaching a short animated GIF of gstat, that shows the pretty constant, but low IOPS writting being done to this optane slog (nvd0 is the optane slog).
(in a day or so i will attach the full gstat output of all 64x devices on this machine- but right now im doing a resilver on a z2 pool, 25h remaining, so the gstat data is not typical/relevant)
FreeNAS-11.2-U5
Platform 2x Intel(R) Xeon(R) CPU E5-2637 v2 @ 3.50GHz
Memory 262067MB (ecc)
full smart output of optane:
Code:
root@freenas:~ # smartctl -a /dev/nvme0
smartctl 6.6 2017-11-05 r4594 FreeBSD 11.2-STABLE amd64 (local build)
Copyright (C) 2002-17, Bruce Allen, Christian Franke, www.smartmontools.org

=== START OF INFORMATION SECTION ===
Model Number:                       INTEL SSDPED1D280GA
Serial Number:                      PHMB74220077280CGN
Firmware Version:                   E2010325
PCI Vendor/Subsystem ID:            0x8086
IEEE OUI Identifier:                0x5cd2e4
Controller ID:                      0
Number of Namespaces:               1
Namespace 1 Size/Capacity:          280,065,171,456 [280 GB]
Namespace 1 Formatted LBA Size:     512
Local Time is:                      Thu Jan 26 16:21:26 2023 CST
Firmware Updates (0x02):            1 Slot
Optional Admin Commands (0x0007):   Security Format Frmw_DL
Optional NVM Commands (0x0006):     Wr_Unc DS_Mngmt
Maximum Data Transfer Size:         32 Pages

Supported Power States
St Op     Max   Active     Idle   RL RT WL WT  Ent_Lat
Code:
 0 +    18.00W       -        -    0  0  0  0        0       0

Supported LBA Sizes (NSID 0x1)
Id Fmt  Data  Metadt  Rel_Perf
 0 +     512       0         2

=== START OF SMART DATA SECTION ===
SMART overall-health self-assessment test result: PASSED

SMART/Health Information (NVMe Log 0x02, NSID 0xffffffff)
Critical Warning:                   0x00
Temperature:                        48 Celsius
Available Spare:                    100%
Available Spare Threshold:          0%
Percentage Used:                    19%
Data Units Read:                    211,160,106 [108 TB]
Data Units Written:                 3,069,275,387 [1.57 PB]
Host Read Commands:                 1,114,164,031
Host Write Commands:                51,883,402,009
Controller Busy Time:               16,695
Power Cycles:                       802
Power On Hours:                     36,374
Unsafe Shutdowns:                   180
Media and Data Integrity Errors:    0
Error Information Log Entries:      0

Error Information (NVMe Log 0x01, max 64 entries)
No Errors Logged

and

root@freenas:~ # smartctl -x /dev/nvme0
smartctl 6.6 2017-11-05 r4594 FreeBSD 11.2-STABLE amd64 (local build)
Copyright (C) 2002-17, Bruce Allen, Christian Franke, www.smartmontools.org

=== START OF INFORMATION SECTION ===
Model Number:                       INTEL SSDPED1D280GA
Serial Number:                      PHMB74220077280CGN
Firmware Version:                   E2010325
PCI Vendor/Subsystem ID:            0x8086
IEEE OUI Identifier:                0x5cd2e4
Controller ID:                      0
Number of Namespaces:               1
Namespace 1 Size/Capacity:          280,065,171,456 [280 GB]
Namespace 1 Formatted LBA Size:     512
Local Time is:                      Fri Jan 27 12:26:37 2023 CST
Firmware Updates (0x02):            1 Slot
Optional Admin Commands (0x0007):   Security Format Frmw_DL
Optional NVM Commands (0x0006):     Wr_Unc DS_Mngmt
Maximum Data Transfer Size:         32 Pages

Supported Power States
St Op     Max   Active     Idle   RL RT WL WT  Ent_Lat  Ex_Lat
 0 +    18.00W       -        -    0  0  0  0        0       0

Supported LBA Sizes (NSID 0x1)
Id Fmt  Data  Metadt  Rel_Perf
 0 +     512       0         2

=== START OF SMART DATA SECTION ===
SMART overall-health self-assessment test result: PASSED

SMART/Health Information (NVMe Log 0x02, NSID 0xffffffff)
Critical Warning:                   0x00
Temperature:                        47 Celsius
Available Spare:                    100%
Available Spare Threshold:          0%
Percentage Used:                    19%
Data Units Read:                    211,160,106 [108 TB]
Data Units Written:                 3,071,689,926 [1.57 PB]
Host Read Commands:                 1,114,164,031
Host Write Commands:                51,921,654,184
Controller Busy Time:               16,707
Power Cycles:                       802
Power On Hours:                     36,394
Unsafe Shutdowns:                   180
Media and Data Integrity Errors:    0
Error Information Log Entries:      0

Error Information (NVMe Log 0x01, max 64 entries)
No Errors Logged
output of zilstat run (1s intervals):
Code:
root@freenas:~ # zilstat 1 50
   N-Bytes  N-Bytes/s N-Max-Rate    B-Bytes  B-Bytes/s B-Max-Rate    ops  <=4kB 4-32kB >=32kB
  22617056   22617056   22617056   88358912   88358912   88358912   2242      8    815   1419
   9544192    9544192    9544656   32432128   32432128   32432128    874     19    552    303
   6231096    6231096    6231096   24092672   24092672   24092672    225      3     11    211
   8936344    8936344    8936344   29749248   29749248   29749248    301     16     17    268
  13796840   13796840   13796840   45375488   45375488   45375488    483      3     51    429
   2237608    2237608    2237608    8822784    8822784    8822784     99      0      8     91
  23383600   23383600   23383600   96387072   96387072   96387072   2506      1    817   1688
  16865520   16865520   16865520   42934272   42934272   42934272    402      0     29    373
   8521384    8521384    8521384   22990848   22990848   22990848    195      0      1    194
   4615960    4615960    4615960   18575360   18575360   18575360    157      0      1    156
  11464224   11464224   11464224   31911936   31911936   31911936    300      1      5    294
  63785856   63785856   63786320  214806528  214806528  214806528   2222     29    231   1962
  84744264   84744264   84744264  293195776  293195776  293195776   2301      1     30   2270
  83609952   83609952   83602408  328921088  328921088  328921088   2562      5      9   2548
  67813760   67813760   67813760  291102720  291102720  291102720   2296      2     22   2272
  10266088   10266088   10266088   33865728   33865728   33865728    331      0     27    304
  11132816   11132816   11132816   34484224   34484224   34484224    902      1    374    527
   8850176    8850176    8850176   27729920   27729920   27729920    256      0      7    249
  30170600   30170600   30170600   70754304   70754304   70754304    591      9      8    574
  10710240   10710240   10710240   24088576   24088576   24088576    196      0      0    196
  48879504   48879504   48858648  184467456  184467456  184336384   1508      7     29   1472
  69692008   69692008   69692008  287502336  287502336  287539200   2330     19     29   2282
  72302728   72302728   72302728  310759424  310759424  310759424   2511      2     20   2489
  28997272   28997272   28997272  130883584  130883584  130883584   1112     11     46   1055
   7739760    7739760    7739760   27127808   27127808   27127808    242      0     22    220
  14318672   14318672   14318672   41119744   41119744   41119744    382      0     23    359
  10420176   10420176   10420176   30257152   30257152   30257152    478      0    149    329
   7456440    7456440    7456440   17944576   17944576   17944576    177      0     26    151
  39877304   39877304   39877304  165265408  165265408  165265408   1351      2     41   1308
  80742520   80742520   80782912  340660224  340660224  340660224   2688      0      3   2685
  74644648   74644648   74649120  344961024  344961024  344973312   2836      0     39   2798
   7303912    7303912    7304376   22134784   22134784   22130688    262     24     43    195
   4218408    4218408    4219296   16695296   16695296   16695296    180      1     11    168
  10524352   10524352   10524352   35930112   35930112   35930112    391     14     45    332
  12099688   12099688   12099688   29573120   29573120   29573120    267      2     11    254
   7222232    7222232    7222232   25305088   25305088   25305088    245      2      6    237
  46359632   46359632   46359632  188637184  188637184  188637184   2614      0    508   2106
  77490640   77490640   77490640  357302272  357302272  357302272   2846      0     19   2827
  38434760   38434760   38435464  186322944  186322944  186322944   1677      8     37   1632
  20512040   20512040   20512040   44974080   44974080   44974080    387      0      4    383
  19645880   19645880   19645880   51703808   51703808   51703808    479      7     16    456
  17549264   17549264   17524688   71061504   71061504   71061504   1266     20    242   1005
   7851696    7851696    7851696   20283392   20283392   20283392    170      2      2    166
   4815968    4815968    4815968   21393408   21393408   21393408    265     25     38    202
  10027720   10027720   10027720   33861632   33861632   33861632    287      1      2    284
  25512480   25512480   25516440   90218496   90218496   90349568    740      0     15    726
  78437160   78437160   78444704  393437184  393437184  393437184   3548      1     22   3525
  46265808   46265808   46265808  250691584  250691584  250691584   2094      0     32   2063
   9154760    9154760    9154760   29265920   29265920   29265920    279      1     16    262
  11180368   11180368   11180368   27009024   27009024   27009024    230      0      5    225
Last edited:
