NVMe Pool Poor? Performance 8X8TB NVMe

b3rkb4l

Cadet
Joined
Oct 25, 2023
Messages
8
Hello,

Recently I have prepared a second TrueNas for my NFS VM Storage. I made some tests and the results are not satisfying at all. Im looking for some advice to get a proper/better result.

Here is my current config on NVMe Pool:

HP DL380 Gen10 With NVMe Expansion Kit
8 x 8 TB Intel DCP4510 U.2 NVMe
2 x Xeon Gold 6136 3.0Ghz (I preffered this for better base clock)
18x64 GB DDR4 2666MHZ ECC Ram Total 1152GB
40G ConnectX-3 Pro For NFS Share over network
2x300GB Sas for TrueNas boot-pool (mirrored)

My Pool configuration;

4 x 2-Way Mirror 28.87 TiB Free
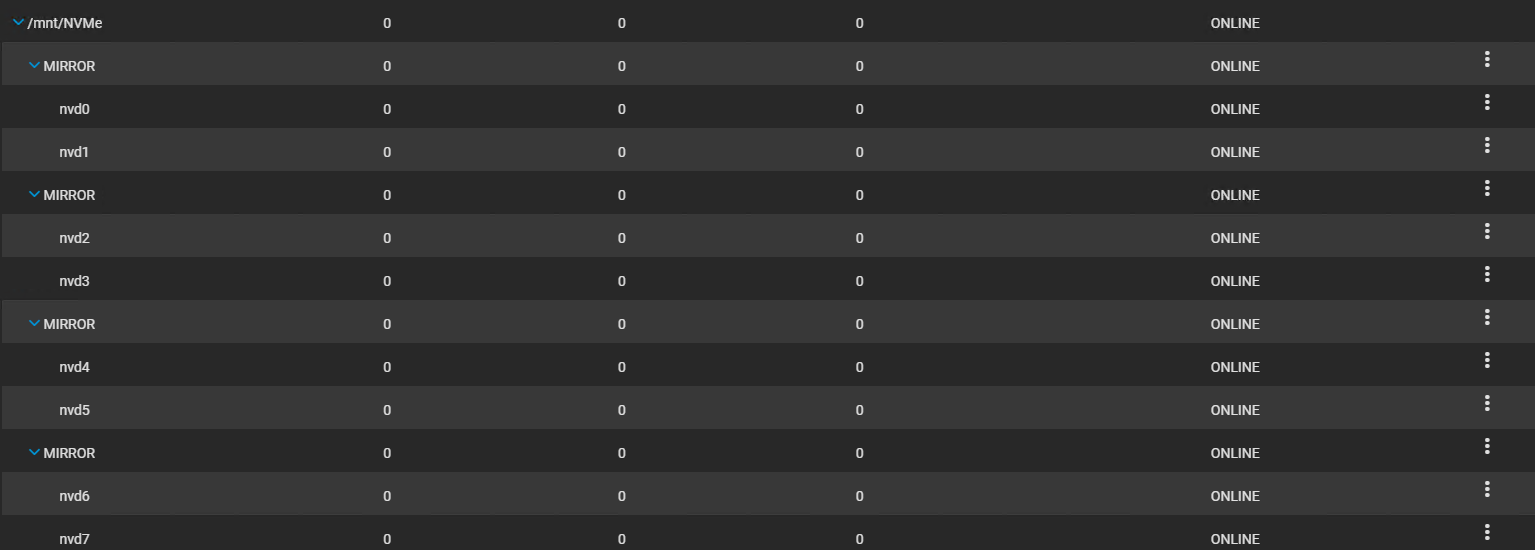
1709972884279.png


I made it this way because I need more iops and redundancy. 30TB is fair enough for me, i can sacrifice size for more iops so i made much vdevs as possible ( more vdevs = more iops)

solnet-array-test results;


Code:
Completed: initial serial array read (baseline speeds)

Array's average speed is 1867.62 MB/sec per disk

Disk    Disk Size  MB/sec %ofAvg
------- ---------- ------ ------
nvd0     7630885MB   1871    100
nvd1     7630885MB   1881    101
nvd2     7630885MB   1844     99
nvd3     7630885MB   1850     99
nvd4     7630885MB   1884    101
nvd5     7630885MB   1891    101
nvd6     7630885MB   1863    100
nvd7     7630885MB   1857     99

Performing initial parallel array read
Fri Mar  8 17:01:09 PST 2024
The disk nvd0 appears to be 7630885 MB.
Disk is reading at about 2380 MB/sec
This suggests that this pass may take around 53 minutes

                   Serial Parall % of
Disk    Disk Size  MB/sec MB/sec Serial
------- ---------- ------ ------ ------
nvd0     7630885MB   1871   2801    150 ++FAST++
nvd1     7630885MB   1881   2834    151 ++FAST++
nvd2     7630885MB   1844   2831    154 ++FAST++
nvd3     7630885MB   1850   2816    152 ++FAST++
nvd4     7630885MB   1884   2813    149 ++FAST++
nvd5     7630885MB   1891   2834    150 ++FAST++
nvd6     7630885MB   1863   2816    151 ++FAST++
nvd7     7630885MB   1857   2833    153 ++FAST++

Awaiting completion: initial parallel array read
Fri Mar  8 17:46:54 PST 2024
Completed: initial parallel array read

Disk's average time is 2732 seconds per disk

Disk    Bytes Transferred Seconds %ofAvg
------- ----------------- ------- ------
nvd0        8001563222016    2740    100
nvd1        8001563222016    2723    100
nvd2        8001563222016    2723    100
nvd3        8001563222016    2739    100
nvd4        8001563222016    2738    100
nvd5        8001563222016    2722    100
nvd6        8001563222016    2745    100
nvd7        8001563222016    2730    100

Performing initial parallel seek-stress array read
Fri Mar  8 17:46:54 PST 2024
The disk nvd0 appears to be 7630885 MB.
Disk is reading at about 3132 MB/sec
This suggests that this pass may take around 41 minutes

                   Serial Parall % of
Disk    Disk Size  MB/sec MB/sec Serial
------- ---------- ------ ------ ------
nvd0     7630885MB   1871   3133    167
nvd1     7630885MB   1881   3134    167
nvd2     7630885MB   1844   3133    170
nvd3     7630885MB   1850   3111    168
nvd4     7630885MB   1884   3125    166
nvd5     7630885MB   1891   3126    165
nvd6     7630885MB   1863   3136    168
nvd7     7630885MB   1857   3125    168


I made some research on forum & web and tested with different tools, configuration etc.
So here is the test results of this pool, with cache and compression disabled ( zfs pool primarycache=none & zfs pool primarycache=metadata)


Code:

zfs get primarycache NVMe
NAME  PROPERTY      VALUE         SOURCE
NVMe  primarycache  metadata      local


BS : 4k & Size 256M
--bs=4k --direct=1 --directory=/mnt/NVMe/ --gtod_reduce=1--ioengine==posixaio
-iodepth=32 --group_reporting --name=randrw --numjobs=24 --ramp_time=10
--runtime=60 --rw=randrw --size=256M --time_based

read: IOPS=32.7k, BW=128MiB/s (134MB/s)(7678MiB/60026msec 
write: IOPS=32.7k, BW=128MiB/s (134MB/s)(7675MiB/60026msec); 

BS: 4K & Size 4M (CPU Usage was %100)

--bs=4k --direct=1 --directory=/mnt/NVMe/ --gtod_reduce=1--ioengine==posixaio
-iodepth=32 --group_reporting --name=randrw --numjobs=24 --ramp_time=10
--runtime=60 --rw=randrw --size=4M --time_based

READ:  IOPS=839k, bw=3279MiB/s (3438MB/s), 3279MiB/s-3279MiB/s (3438MB/s-3438MB/s), io=96.1GiB (103GB), run=30002-30002msec
WRITE: IOPS=839k, bw=3278MiB/s (3437MB/s), 3278MiB/s-3278MiB/s (3437MB/s-3437MB/s), io=96.0GiB (103GB), run=30002-30002msec

BS: 4K & Size 1M (CPU Usage was %100)

read: IOPS=872k, BW=3406MiB/s (3572MB/s)(99.8GiB/30002msec)
write: IOPS=872k, BW=3405MiB/s (3570MB/s)(99.8GiB/30002msec); 

BS : 128k & Size 256M (CPU Usage was %100)
--bs=128k --direct=1 --directory=/mnt/NVMe/ --gtod_reduce=1--ioengine==posixaio
-iodepth=32 --group_reporting --name=randrw --numjobs=24 --ramp_time=10
--runtime=60 --rw=randrw --size=256M --time_based

READ: bw=4174MiB/s (4377MB/s), 4174MiB/s-4174MiB/s (4377MB/s-4377MB/s), io=245GiB (263GB), run=60025-60025msec
 WRITE: bw=4171MiB/s (4374MB/s), 4171MiB/s-4171MiB/s (4374MB/s-4374MB/s), io=245GiB (263GB), run=60025-60025msec

BS : 128k & Size 4M (CPU Usage was %100)

read: IOPS=425k, BW=51.9GiB/s (55.8GB/s)(1558GiB/30002msec)
write: IOPS=425k, BW=51.9GiB/s (55.8GB/s)(1558GiB/30002msec); 0 zone resets


BS : 128k & Size 1M (CPU Usage was %100)

read: IOPS=684k, BW=83.5GiB/s (89.6GB/s)(2505GiB/30002msec)
write: IOPS=683k, BW=83.4GiB/s (89.6GB/s)(2503GiB/30002msec); 0 zone resets


I tried to make much tests as possible, i can make another tests if its needed. The main improvement i want to make here is IOPS, i don't need much throughput at all.

Each disk gives around 650k? read iops, so im thinking i need to get at least 2M IOPS?


Thanks
 

fredbourdelier

Dabbler
Joined
Sep 11, 2022
Messages
27
Hello b3rkb4l

I don't have direct knowledge of using NVMe on an HP platform, but I have the same-purpose config on a DELL PowerEdge R750/gen2 with split front PERC hosting 8 NVMe slots with WD Ultrastar® DC SN640 7.68 SSDs as the main pool/Z2/one vdev (separate boot pool on SAS). CPU 2 Xeon silver 4309Y @ 2.80, 128GB DDR4/2400. VM hosting on VMWare ESXi 7.x for 3 machine cluster with 2 primary VM hosts running 50 VMs, mostly on Windows Server 2022 Datacenter. Workloads are variable, with some analytics, CAD, and engineering simulators putting pretty good load on the servers, most VMs idle along. The R750 LUN host is connected to each VM host by a dedicated 10GBe crossover (non-switched, private network), plus the LUN host has a 10GBe connection to the main backbone.

I few thoughts: The LUN host on average uses <2% of its CPU and <40% of disk performance capacity (per TNAS dashboard). I don't know your VM host, but VMware likes to machine-gun writes to its VM images just as much as reading (something about how it does data integrity), so both R and W performance will matter. Quick side note, the main array is currently 84% utilized per TNAS, but that's just because it's defined as a VMWARE LUN and thick provisioned. Internally the LUN is only 30% used.

That said, I've run a few benchmarks on the system, and while the block and job sizes don't match your tests, the results are in the same ball park. Someone suggested that, because of where the NVMe controller interfaces with Xeon chipsets, it can get held up in processor arbitration/cache cycles, and that a single CPU might end up being faster in absolute I/O to disk arrays. I haven't tested this theory.

R750------3 sets of tests: Cache Metadata/32 threads/4k/4G/IODepth 1; Cache All/32 threads/4k/4G/IODepth 1; Cache All/8 threads/4k/4G/IODepth 128

zfs set primarycache=metadata NVME-Pool-01
fio --filename=test --direct=1 --rw=randrw --randrepeat=0 --rwmixread=0--iodepth=16 --numjobs=32 --runtime=60 --group_reporting --name=4ktest --size=4G --bs=4k

4ktest: (g=0): rw=randrw, bs=(R) 4096B-4096B, (W) 4096B-4096B, (T) 4096B-4096B,ioengine=psync, iodepth=1
...
fio-3.28
Starting 32 processes
4ktest: Laying out IO file (1 file / 4096MiB)
Jobs: 32 (f=32): [w(32)][100.0%][w=48.5MiB/s][w=12.4k IOPS][eta 00m:00s]
4ktest: (groupid=0, jobs=32): err= 0: pid=26893: Mon Jan 15 12:37:00 2024
write: IOPS=10.9k, BW=42.5MiB/s (44.6MB/s)(2552MiB/60005msec); 0 zone resets
clat (usec): min=10, max=11109, avg=2931.62, stdev=795.50
lat (usec): min=10, max=11109, avg=2932.27, stdev=795.57
clat percentiles (usec):
| 1.00th=[ 92], 5.00th=[ 1926], 10.00th=[ 2008], 20.00th=[ 2212],
| 30.00th=[ 2442], 40.00th=[ 2671], 50.00th=[ 2933], 60.00th=[ 3195],
| 70.00th=[ 3490], 80.00th=[ 3752], 90.00th=[ 3949], 95.00th=[ 4047],
| 99.00th=[ 4178], 99.50th=[ 4228], 99.90th=[ 4293], 99.95th=[ 4359],
| 99.99th=[ 4883]
bw ( KiB/s): min=30584, max=141641, per=100.00%, avg=43634.17, stdev=406.78, samples=3808
iops : min= 7630, max=35410, avg=10900.03, stdev=101.80, samples=3808
lat (usec) : 20=0.03%, 50=0.29%, 100=0.78%, 250=0.53%, 500=0.15%
lat (usec) : 750=0.09%, 1000=0.08%
lat (msec) : 2=7.35%, 4=84.06%, 10=6.65%, 20=0.01%
cpu : usr=0.36%, sys=2.24%, ctx=646148, majf=0, minf=0
IO depths : 1=100.0%, 2=0.0%, 4=0.0%, 8=0.0%, 16=0.0%, 32=0.0%, >=64=0.0%
submit : 0=0.0%, 4=100.0%, 8=0.0%, 16=0.0%, 32=0.0%, 64=0.0%, >=64=0.0%
complete : 0=0.0%, 4=100.0%, 8


re-run test 3/9/2024 84% array utilized
...
fio-3.28
Starting 32 processes
Jobs: 32 (f=32): [w(32)][100.0%][w=34.7MiB/s][w=8893 IOPS][eta 00m:00s]
4ktest: (groupid=0, jobs=32): err= 0: pid=75643: Sat Mar 9 06:20:43 2024
write: IOPS=11.1k, BW=43.3MiB/s (45.4MB/s)(2599MiB/60005msec); 0 zone resets
clat (usec): min=4, max=170073, avg=2881.36, stdev=1945.38
lat (usec): min=4, max=170073, avg=2881.78, stdev=1945.42
clat percentiles (usec):
| 1.00th=[ 20], 5.00th=[ 128], 10.00th=[ 1942], 20.00th=[ 2147],
| 30.00th=[ 2376], 40.00th=[ 2638], 50.00th=[ 2900], 60.00th=[ 3195],
| 70.00th=[ 3490], 80.00th=[ 3752], 90.00th=[ 3949], 95.00th=[ 4015],
| 99.00th=[ 4178], 99.50th=[ 4293], 99.90th=[22938], 99.95th=[44303],
| 99.99th=[83362]
bw ( KiB/s): min=29760, max=143630, per=100.00%, avg=44434.61, stdev=480.56, samples=3808
iops : min= 7424, max=35895, avg=11100.94, stdev=120.19, samples=3808
lat (usec) : 10=0.52%, 20=0.52%, 50=0.51%, 100=3.01%, 250=0.86%
lat (usec) : 500=0.16%, 750=0.05%, 1000=0.03%
lat (msec) : 2=7.04%, 4=81.71%, 10=5.45%, 20=0.04%, 50=0.07%
lat (msec) : 100=0.03%, 250=0.01%
cpu : usr=0.24%, sys=3.33%, ctx=683994, majf=0, minf=0
IO depths : 1=100.0%, 2=0.0%, 4=0.0%, 8=0.0%, 16=0.0%, 32=0.0%, >=64=0.0%
submit : 0=0.0%, 4=100.0%, 8=0.0%, 16=0.0%, 32=0.0%, 64=0.0%, >=64=0.0%
complete : 0=0.0%, 4=100.0%, 8=


zfs set primarycache=all NVME-Pool-01
fio --filename=test --direct=1 --rw=randrw --randrepeat=0 --rwmixread=0--iodepth=16 --numjobs=32 --runtime=60 --group_reporting --name=4ktest --size=4G --bs=4k


4ktest: (g=0): rw=randrw, bs=(R) 4096B-4096B, (W) 4096B-4096B, (T) 4096B-4096B,ioengine=psync, iodepth=1
...
fio-3.28
Starting 32 processes
Jobs: 32 (f=32): [w(32)][100.0%][w=32.5MiB/s][w=8314 IOPS][eta 00m:00s]
4ktest: (groupid=0, jobs=32): err= 0: pid=26963: Mon Jan 15 12:40:08 2024
write: IOPS=11.1k, BW=43.4MiB/s (45.5MB/s)(2602MiB/60005msec); 0 zone resets
clat (usec): min=8, max=49721, avg=2875.36, stdev=933.71
lat (usec): min=8, max=49722, avg=2876.01, stdev=933.80
clat percentiles (usec):
| 1.00th=[ 50], 5.00th=[ 1860], 10.00th=[ 1975], 20.00th=[ 2180],
| 30.00th=[ 2409], 40.00th=[ 2638], 50.00th=[ 2900], 60.00th=[ 3195],
| 70.00th=[ 3490], 80.00th=[ 3752], 90.00th=[ 3949], 95.00th=[ 4015],
| 99.00th=[ 4146], 99.50th=[ 4178], 99.90th=[ 4293], 99.95th=[ 4293],
| 99.99th=[11338]
bw ( KiB/s): min=31210, max=251749, per=100.00%, avg=44482.77, stdev=699.81, samples=3808
iops : min= 7789, max=62926, avg=11113.09, stdev=174.98, samples=3808
lat (usec) : 10=0.01%, 20=0.12%, 50=0.90%, 100=1.39%, 250=1.23%
lat (usec) : 500=0.24%, 750=0.11%, 1000=0.10%
lat (msec) : 2=6.94%, 4=82.94%, 10=6.03%, 20=0.01%, 50=0.01%
cpu : usr=0.40%, sys=2.31%, ctx=644611, majf=0, minf=0
IO depths : 1=100.0%, 2=0.0%, 4=0.0%, 8=0.0%, 16=0.0%, 32=0.0%, >=64=0.0%
submit : 0=0.0%, 4=100.0%, 8=0.0%, 16=0.0%, 32=0.0%, 64=0.0%, >=64=0.0%
complete : 0=0.0%, 4=100.0%, 8


Re-run test 3/9/2024 84% array utilization
4ktest: (g=0): rw=randrw, bs=(R) 4096B-4096B, (W) 4096B-4096B, (T) 4096B-4096B,ioengine=psync, iodepth=1
...
fio-3.28
Starting 32 processes
Jobs: 32 (f=32): [w(32)][100.0%][w=33.4MiB/s][w=8540 IOPS][eta 00m:00s]
4ktest: (groupid=0, jobs=32): err= 0: pid=75721: Sat Mar 9 06:23:56 2024
write: IOPS=11.1k, BW=43.4MiB/s (45.5MB/s)(2602MiB/60005msec); 0 zone resets
clat (usec): min=6, max=103680, avg=2876.39, stdev=1207.36
lat (usec): min=6, max=103680, avg=2876.88, stdev=1207.40
clat percentiles (usec):
| 1.00th=[ 58], 5.00th=[ 1827], 10.00th=[ 1991], 20.00th=[ 2180],
| 30.00th=[ 2409], 40.00th=[ 2638], 50.00th=[ 2900], 60.00th=[ 3195],
| 70.00th=[ 3490], 80.00th=[ 3752], 90.00th=[ 3916], 95.00th=[ 4015],
| 99.00th=[ 4146], 99.50th=[ 4228], 99.90th=[ 4555], 99.95th=[ 6915],
| 99.99th=[30278]
bw ( KiB/s): min=30328, max=247619, per=100.00%, avg=44474.24, stdev=685.61, samples=3808
iops : min= 7582, max=61898, avg=11110.23, stdev=171.46, samples=3808
lat (usec) : 10=0.02%, 20=0.07%, 50=0.76%, 100=1.46%, 250=1.53%
lat (usec) : 500=0.29%, 750=0.11%, 1000=0.09%
lat (msec) : 2=6.30%, 4=83.97%, 10=5.35%, 20=0.02%, 50=0.01%
lat (msec) : 100=0.01%, 250=0.01%
cpu : usr=0.27%, sys=2.07%, ctx=663437, majf=0, minf=0
IO depths : 1=100.0%, 2=0.0%, 4=0.0%, 8=0.0%, 16=0.0%, 32=0.0%, >=64=0.0%
submit : 0=0.0%, 4=100.0%, 8=0.0%, 16=0.0%, 32=0.0%, 64=0.0%, >=64=0.0%
complete : 0=0.0%, 4=100.0%, 8


_________________________________________________________________________________________________
fio --filename=test --direct=1 --rw=randrw --randrepeat=0 --rwmixread=100 --iodepth=128 --numjobs=8 --runtime=60 --group_reporting --name=4ktest --ioengine=psync --size=4G --bs=4k

4ktest: (g=0): rw=randrw, bs=(R) 4096B-4096B, (W) 4096B-4096B, (T) 4096B-4096B,ioengine=psync, iodepth=128
...
fio-3.28
Starting 8 processes
Jobs: 8 (f=8): [r(8)][100.0%][r=2384MiB/s][r=610k IOPS][eta 00m:00s]
4ktest: (groupid=0, jobs=8): err= 0: pid=27080: Mon Jan 15 12:46:33 2024
read: IOPS=500k, BW=1954MiB/s (2049MB/s)(32.0GiB/16770msec)
clat (nsec): min=1364, max=4143.2k, avg=15464.48, stdev=19955.32
lat (nsec): min=1395, max=4144.1k, avg=15519.88, stdev=19957.24
clat percentiles (usec):
| 1.00th=[ 4], 5.00th=[ 5], 10.00th=[ 6], 20.00th=[ 7],
| 30.00th=[ 7], 40.00th=[ 8], 50.00th=[ 8], 60.00th=[ 9],
| 70.00th=[ 11], 80.00th=[ 36], 90.00th=[ 41], 95.00th=[ 44],
| 99.00th=[ 59], 99.50th=[ 72], 99.90th=[ 137], 99.95th=[ 260],
| 99.99th=[ 758]
bw ( MiB/s): min= 1282, max= 2463, per=99.23%, avg=1939.01, stdev=22.93, samples=256
iops : min=328439, max=630595, avg=496384.28, stdev=5869.84, samples=256
lat (usec) : 2=0.01%, 4=1.53%, 10=66.60%, 20=9.12%, 50=20.19%
lat (usec) : 100=2.38%, 250=0.12%, 500=0.03%, 750=0.01%, 1000=0.01%
lat (msec) : 2=0.01%, 4=0.01%, 10=0.01%
cpu : usr=4.11%, sys=95.77%, ctx=4439, majf=0, minf=0
IO depths : 1=100.0%, 2=0.0%, 4=0.0%, 8=0.0%, 16=0.0%, 32=0.0%, >=64=0.0%
submit : 0=0.0%, 4=100.0%, 8=0.0%, 16=0.0%, 32=0.0%, 64=0.0%, >=64=0.0%
complete : 0=0.0%, 4=100.0%, 8


run test 3/9/2024 84% used disk array
fio --filename=test --direct=1 --rw=randrw --randrepeat=0 --rwmixread=100 --iodepth=128 --numjobs=8 --runtime=60 --group_reporting --name=4ktest --ioengine=psync --size=4G --bs=4k
4ktest: (g=0): rw=randrw, bs=(R) 4096B-4096B, (W) 4096B-4096B, (T) 4096B-4096B,ioengine=psync, iodepth=128
...
fio-3.28
Starting 8 processes
Jobs: 8 (f=8): [r(8)][94.1%][r=1500MiB/s][r=384k IOPS][eta 00m:02s]
4ktest: (groupid=0, jobs=8): err= 0: pid=75570: Sat Mar 9 06:14:59 2024
read: IOPS=264k, BW=1030MiB/s (1080MB/s)(32.0GiB/31815msec)
clat (nsec): min=1367, max=39616k, avg=29496.21, stdev=112803.45
lat (nsec): min=1395, max=39616k, avg=29570.15, stdev=112809.18
clat percentiles (usec):
| 1.00th=[ 4], 5.00th=[ 7], 10.00th=[ 8], 20.00th=[ 10],
| 30.00th=[ 11], 40.00th=[ 12], 50.00th=[ 13], 60.00th=[ 15],
| 70.00th=[ 19], 80.00th=[ 58], 90.00th=[ 69], 95.00th=[ 76],
| 99.00th=[ 125], 99.50th=[ 338], 99.90th=[ 832], 99.95th=[ 996],
| 99.99th=[ 2442]
bw ( KiB/s): min=41715, max=2167866, per=99.41%, avg=1048405.77, stdev=47620.27, samples=498
iops : min=10427, max=541964, avg=262098.93, stdev=11905.08, samples=498
lat (usec) : 2=0.03%, 4=1.05%, 10=25.02%, 20=45.48%, 50=6.07%
lat (usec) : 100=20.96%, 250=0.78%, 500=0.12%, 750=0.30%, 1000=0.12%
lat (msec) : 2=0.04%, 4=0.01%, 10=0.01%, 20=0.01%, 50=0.01%
cpu : usr=2.75%, sys=86.65%, ctx=81433, majf=0, minf=0
IO depths : 1=100.0%, 2=0.0%, 4=0.0%, 8=0.0%, 16=0.0%, 32=0.0%, >=64=0.0%
submit : 0=0.0%, 4=100.0%, 8=0.0%, 16=0.0%, 32=0.0%, 64=0.0%, >=64=0.0%
complete : 0=0.0%, 4=100.0%, 8=0.
 

b3rkb4l

Cadet
Joined
Oct 25, 2023
Messages
8
Thank you for your reply fredbourdelier . I didn't tested this on VM side yet. Im using proxmox on vm environment, so KVM drivers and customizations on disk side is helping me somehow. But Still iops is not enough for this configuration i think. Thank you for giving time for making tests, i made tests with commands you sent too, im getting lower values than your setup even in my config cpu is slightly better. I have tried changing core to scale but i did not get an decent result on that too. Im still trying to figure it out where the bottleneck is.
 

b3rkb4l

Cadet
Joined
Oct 25, 2023
Messages
8
1710007305900.png


@fredbourdelier i have installed windows on same machine for do some testing, these are the results i get from crystalbenchmark, i don't know how is this disk hits 700k iops on write, it should be lower than 130k regarding datasheet. Also, when benchmarking cpu gets %40-50 maybe cpu is the bottleneck or maybe its like that because of windows. I will write updates on thread.
 

fredbourdelier

Dabbler
Joined
Sep 11, 2022
Messages
27
That is interesting @b3rkb4l I don't see it either - unless the size of the benchmark file is within the cache size on the SSD?

I bought a TeamGroup 1Tb SATA consumer SSD for an HP laptop, to use as a 2nd drive, and I've found that as long as I write only enough data to stay within the drive's cache, its speeds are amazing - but as soon as the cache fills up, performance is ridiculously slow, and data transfer drops to <20MB/s. It gets worse as the drive gets full. I'm not sure if there is any correlation to enterprise SSDs in how internal cache on the drive units might affect write performance, or if "after the cache fills up" on enterprise drives might have a similar effect on some benchmarks more than others.
 

firesyde424

Contributor
Joined
Mar 5, 2019
Messages
155
Understand that TrueNAS isn't optimized for this kind of performance level. What is your CPU usage like when you run these tests?
 

b3rkb4l

Cadet
Joined
Oct 25, 2023
Messages
8
Understand that TrueNAS isn't optimized for this kind of performance level. What is your CPU usage like when you run these tests?
100 percent on most of tests with 24 jobs, i have added cpu levels to side of tests.
 

fredbourdelier

Dabbler
Joined
Sep 11, 2022
Messages
27
Understand that TrueNAS isn't optimized for this kind of performance level. What is your CPU usage like when you run these tests?
Various cores run up to 100%, but it's variable, both in terms of which cores, for how long, and how many.
1710164790932.png

Is the CPU-bound condition because the disk controller is set to "no intelligence" and code has to do everything at the main OS core level? I see it's multithreaded at least, but I do tend to agree there's no offloading there.
 

firesyde424

Contributor
Joined
Mar 5, 2019
Messages
155
100 percent on most of tests with 24 jobs, i have added cpu levels to side of tests.
If you are CPU maxed, then that's likely a good indicator why your performance isn't meeting your expectations. In synthetic testing, with 24 x 30.72TB NVME drives, I was able to overwhelm a pair of 64 core AMD CPUs.
 

firesyde424

Contributor
Joined
Mar 5, 2019
Messages
155
Various cores run up to 100%, but it's variable, both in terms of which cores, for how long, and how many. View attachment 76472
Is the CPU-bound condition because the disk controller is set to "no intelligence" and code has to do everything at the main OS core level? I see it's multithreaded at least, but I do tend to agree there's no offloading there.
Remember that, especially in NVME based systems, the CPU is doing everything. This includes moving data from point A to point B, scrubs, parity(though not in the OP's example), ect. Many of those tasks are single threaded which is likely what you are seeing above. An example is the fio processes that are spun up for synthetic testing. You specified 8 processes in your fio command, so that's why you see 8 cores maxed out at 100%. As for those workloads jumping around, that's just the operating system handling task allocation. It's completely normal and all modern operating systems do it. If you were to open Windows task manager and go to the logical core view, you'd see this in action as the Windows kernel moves different tasks to different cores.
 

b3rkb4l

Cadet
Joined
Oct 25, 2023
Messages
8
Remember that, especially in NVME based systems, the CPU is doing everything. This includes moving data from point A to point B, scrubs, parity(though not in the OP's example), ect. Many of those tasks are single threaded which is likely what you are seeing above. An example is the fio processes that are spun up for synthetic testing. You specified 8 processes in your fio command, so that's why you see 8 cores maxed out at 100%. As for those workloads jumping around, that's just the operating system handling task allocation. It's completely normal and all modern operating systems do it. If you were to open Windows task manager and go to the logical core view, you'd see this in action as the Windows kernel moves different tasks to different cores.
When i tested with 24 jobs and low byte size / size, i hit up to 900k iops as you can see on tests i shared. And on this test all cores of cpu is %100. So with this information, I assume this is the maximum power of this CPU, is this true? If its this way i will make an cpu upgrade
 

fredbourdelier

Dabbler
Joined
Sep 11, 2022
Messages
27
Remember that, especially in NVME based systems, the CPU is doing everything. This includes moving data from point A to point B, scrubs, parity(though not in the OP's example), ect. Many of those tasks are single threaded which is likely what you are seeing above. An example is the fio processes that are spun up for synthetic testing. You specified 8 processes in your fio command, so that's why you see 8 cores maxed out at 100%. As for those workloads jumping around, that's just the operating system handling task allocation. It's completely normal and all modern operating systems do it. If you were to open Windows task manager and go to the logical core view, you'd see this in action as the Windows kernel moves different tasks to different cores.
That's the key to the whole business - NVMe is fast and cheap because it lacks most of the components of other I/O protocols. It offloads work to the main processors, not to a secondary processor such as a SCSI.

Sure enough, running the same test on an 8x18TB array SAS/12GB on a PERC330HBA in LSI mode (DELL PowerEdge R730XD) barely tickles the CPUs
1710238750423.png

Jobs: 32 (f=32): [w(32)][100.0%][w=40.7MiB/s][w=10.4k IOPS][eta 00m:00s]
4ktest: (groupid=0, jobs=32): err= 0: pid=14906: Tue Mar 12 06:15:31 2024

write: IOPS=13.2k, BW=51.6MiB/s (54.1MB/s)(3098MiB/60003msec); 0 zone resets
bw ( KiB/s): min=35685, max=107163, per=100.00%, avg=52879.27, stdev=351.86, samples=3776
iops : min= 8905, max=26784, avg=13209.97, stdev=87.97, samples=3776
cpu : usr=0.09%, sys=0.91%, ctx=786506, majf=0, minf=0

Thanks @firesyde424 for explaining that clearly enough that even I got it!
 

firesyde424

Contributor
Joined
Mar 5, 2019
Messages
155
That's the key to the whole business - NVMe is fast and cheap because it lacks most of the components of other I/O protocols. It offloads work to the main processors, not to a secondary processor such as a SCSI.

Sure enough, running the same test on an 8x18TB array SAS/12GB on a PERC330HBA in LSI mode (DELL PowerEdge R730XD) barely tickles the CPUs
View attachment 76500
Jobs: 32 (f=32): [w(32)][100.0%][w=40.7MiB/s][w=10.4k IOPS][eta 00m:00s]
4ktest: (groupid=0, jobs=32): err= 0: pid=14906: Tue Mar 12 06:15:31 2024

write: IOPS=13.2k, BW=51.6MiB/s (54.1MB/s)(3098MiB/60003msec); 0 zone resets
bw ( KiB/s): min=35685, max=107163, per=100.00%, avg=52879.27, stdev=351.86, samples=3776
iops : min= 8905, max=26784, avg=13209.97, stdev=87.97, samples=3776
cpu : usr=0.09%, sys=0.91%, ctx=786506, majf=0, minf=0

Thanks @firesyde424 for explaining that clearly enough that even I got it!
Sort of. In TrueNAS and most other software defined storage such as VMware vSAN, the heavy lifting that a RAID controller would do is done by the CPU regardless of what drives are being used. In the example you mention here, the HBA330 is merely acting as an adapter to allow the CPU to communicate with the SAS drives. Quite literally, Host Bus Adapter.

Incidentally, the Dell HBA330 is just a rebrand of the LSI 9300-8i and can be used with TrueNAS Core out of the box, with its Dell firmware, no cross flashing required.

Given the results you show here and the results from your NVME testing, I'm not sure why you are seeing so much lower CPU usage on the SAS based system. There are a number of things that affect CPU usage such as vdev size and configuration, block size, ect. In theory, if all things were equal and you benchmarked a SAS mechanical system against an NVME system as you've done here, I would expect CPU usage to be lower on the SAS system, but not dramatically so. Here's where my knowledge of TrueNAS fails me a little bit. In my head, a parity calculation should be the same regardless of what kind of drive is being written to. So, I would assume that a parity calculation would use the same amount of CPU on an NVME system as a SAS based system.
 

firesyde424

Contributor
Joined
Mar 5, 2019
Messages
155
When i tested with 24 jobs and low byte size / size, i hit up to 900k iops as you can see on tests i shared. And on this test all cores of cpu is %100. So with this information, I assume this is the maximum power of this CPU, is this true? If its this way i will make an cpu upgrade
It's very likely you would need more CPU power to increase performance beyond what you are currently seeing. Since you are using mirrored vdevs, your CPU doesn't have the overhead of parity calculations. CPU usage can be reduced by decreasing vdev sizes but, short of moving to a striped pool which I DO NOT RECOMMEND, you are already at the smallest vdev size possible.

If your testing has revealed that the current 28 CPU cores can only deliver about 900K IO before maxing out, it would logically follow that you would need approximately 64 cores of CPU power to obtain the 2 million IO. I would pad a little because the system needs to do other things besides transferring data to and from the NVME drives, so let's say 72 to 80 cores total. I'm not aware of a configuration for the 10th gen HP DL380 that gets you there.

I have a system here in production use with 128 cores, 24 x 30.72TB NVME drives, and a 12 x 2 mirrored pool configuration. In synthetic testing at 4K block sizes, we were able to break 4 million IO but that was in sequential IO, not random IO. The best we were able to do at 50% randrw was 1.2 million IO. All of that dropped significantly when we introduced NFS into the equation.

***Edit***
The system I describe above currently runs approximately 10GB/sec when pushed with a large workload from the attached Oracle database server, at 16K block sizes. This is accomplished via 4 x 100Gbe direct connections between the Oracle and TrueNAS servers, no switches involved. When this is happening, the TrueNAS server will run approximately 30-40% CPU utilization. Best guess on that one is about 600K IO at 16K block sizes.
 
Top