I destroyed the dataset and re-created it. During that process, Truenas sent an alert about a disk issue so that's been replaced.
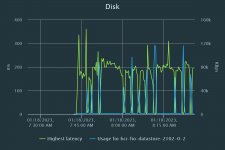
now I'm getting about 101k IOPS and 400ish MB/s for reads and writes.
writes
Code:
 fio --filename=test --direct=1 --rw=randrw  --randrepeat=0 --rwmixread=100 --iodepth=128 --numjobs=12 --runtime=60 --group_reporting --name=4ktest --ioengine=psync --size=4G --bs=4k
4ktest: (g=0): rw=randrw, bs=(R) 4096B-4096B, (W) 4096B-4096B, (T) 4096B-4096B, ioengine=psync, iodepth=128
...
fio-3.28
Starting 12 processes
4ktest: Laying out IO file (1 file / 4096MiB)
Jobs: 12 (f=12): [r(12)][100.0%][r=393MiB/s][r=101k IOPS][eta 00m:00s]
4ktest: (groupid=0, jobs=12): err= 0: pid=8181: Wed Jan 18 18:23:29 2023
  read: IOPS=101k, BW=393MiB/s (412MB/s)(23.0GiB/60002msec)
    clat (nsec): min=1142, max=2033.2k, avg=115234.72, stdev=54456.22
     lat (nsec): min=1173, max=2033.4k, avg=115657.83, stdev=54512.98
    clat percentiles (usec):
     |  1.00th=[    7],  5.00th=[   11], 10.00th=[   16], 20.00th=[   92],
     | 30.00th=[  101], 40.00th=[  110], 50.00th=[  123], 60.00th=[  137],
     | 70.00th=[  147], 80.00th=[  155], 90.00th=[  165], 95.00th=[  174],
     | 99.00th=[  208], 99.50th=[  269], 99.90th=[  510], 99.95th=[  578],
     | 99.99th=[  840]
   bw (  KiB/s): min=319881, max=561475, per=100.00%, avg=403066.91, stdev=5629.87, samples=1416
   iops        : min=79965, max=140366, avg=100762.93, stdev=1407.46, samples=1416
  lat (usec)   : 2=0.01%, 4=0.06%, 10=4.01%, 20=8.58%, 50=2.20%
  lat (usec)   : 100=14.05%, 250=70.50%, 500=0.49%, 750=0.09%, 1000=0.02%
  lat (msec)   : 2=0.01%, 4=0.01%
  cpu          : usr=4.26%, sys=95.71%, ctx=15540, majf=0, minf=0
  IO depths    : 1=100.0%, 2=0.0%, 4=0.0%, 8=0.0%, 16=0.0%, 32=0.0%, >=64=0.0%
     submit    : 0=0.0%, 4=100.0%, 8=0.0%, 16=0.0%, 32=0.0%, 64=0.0%, >=64=0.0%
     complete  : 0=0.0%, 4=100.0%, 8=0.0%, 16=0.0%, 32=0.0%, 64=0.0%, >=64=0.0%
     issued rwts: total=6040028,0,0,0 short=0,0,0,0 dropped=0,0,0,0
     latency   : target=0, window=0, percentile=100.00%, depth=128

Run status group 0 (all jobs):
   READ: bw=393MiB/s (412MB/s), 393MiB/s-393MiB/s (412MB/s-412MB/s), io=23.0GiB (24.7GB), run=60002-60002msec
Reads
Code:
fio --filename=test --direct=1 --rw=randread  --randrepeat=0 --rwmixread=100 --iodepth=128 --numjobs=12 --runtime=60 --group_reporting --name=4ktest --ioengine=psync --size=4G --bs=4k
4ktest: (g=0): rw=randread, bs=(R) 4096B-4096B, (W) 4096B-4096B, (T) 4096B-4096B, ioengine=psync, iodepth=128
...
fio-3.28
Starting 12 processes
Jobs: 12 (f=12): [r(12)][100.0%][r=394MiB/s][r=101k IOPS][eta 00m:00s]
4ktest: (groupid=0, jobs=12): err= 0: pid=8203: Wed Jan 18 18:24:39 2023
  read: IOPS=101k, BW=393MiB/s (412MB/s)(23.0GiB/60001msec)
    clat (nsec): min=1192, max=2055.0k, avg=115388.32, stdev=55384.50
     lat (nsec): min=1242, max=2055.7k, avg=115786.01, stdev=55442.73
    clat percentiles (usec):
     |  1.00th=[    7],  5.00th=[   11], 10.00th=[   16], 20.00th=[   91],
     | 30.00th=[  100], 40.00th=[  109], 50.00th=[  122], 60.00th=[  137],
     | 70.00th=[  149], 80.00th=[  157], 90.00th=[  167], 95.00th=[  176],
     | 99.00th=[  212], 99.50th=[  273], 99.90th=[  523], 99.95th=[  635],
     | 99.99th=[  914]
   bw (  KiB/s): min=310696, max=581146, per=100.00%, avg=402954.42, stdev=5978.06, samples=1416
   iops        : min=77670, max=145283, avg=100734.63, stdev=1494.51, samples=1416
  lat (usec)   : 2=0.01%, 4=0.06%, 10=4.10%, 20=8.52%, 50=2.18%
  lat (usec)   : 100=15.06%, 250=69.46%, 500=0.50%, 750=0.09%, 1000=0.02%
  lat (msec)   : 2=0.01%, 4=0.01%
  cpu          : usr=4.09%, sys=95.88%, ctx=14638, majf=0, minf=12
  IO depths    : 1=100.0%, 2=0.0%, 4=0.0%, 8=0.0%, 16=0.0%, 32=0.0%, >=64=0.0%
     submit    : 0=0.0%, 4=100.0%, 8=0.0%, 16=0.0%, 32=0.0%, 64=0.0%, >=64=0.0%
     complete  : 0=0.0%, 4=100.0%, 8=0.0%, 16=0.0%, 32=0.0%, 64=0.0%, >=64=0.0%
     issued rwts: total=6038347,0,0,0 short=0,0,0,0 dropped=0,0,0,0
     latency   : target=0, window=0, percentile=100.00%, depth=128

Run status group 0 (all jobs):
   READ: bw=393MiB/s (412MB/s), 393MiB/s-393MiB/s (412MB/s-412MB/s), io=23.0GiB (24.7GB), run=60001-60001msec