
Kuro Houou
Contributor
- Joined
- Jun 17, 2014
- Messages
- 193
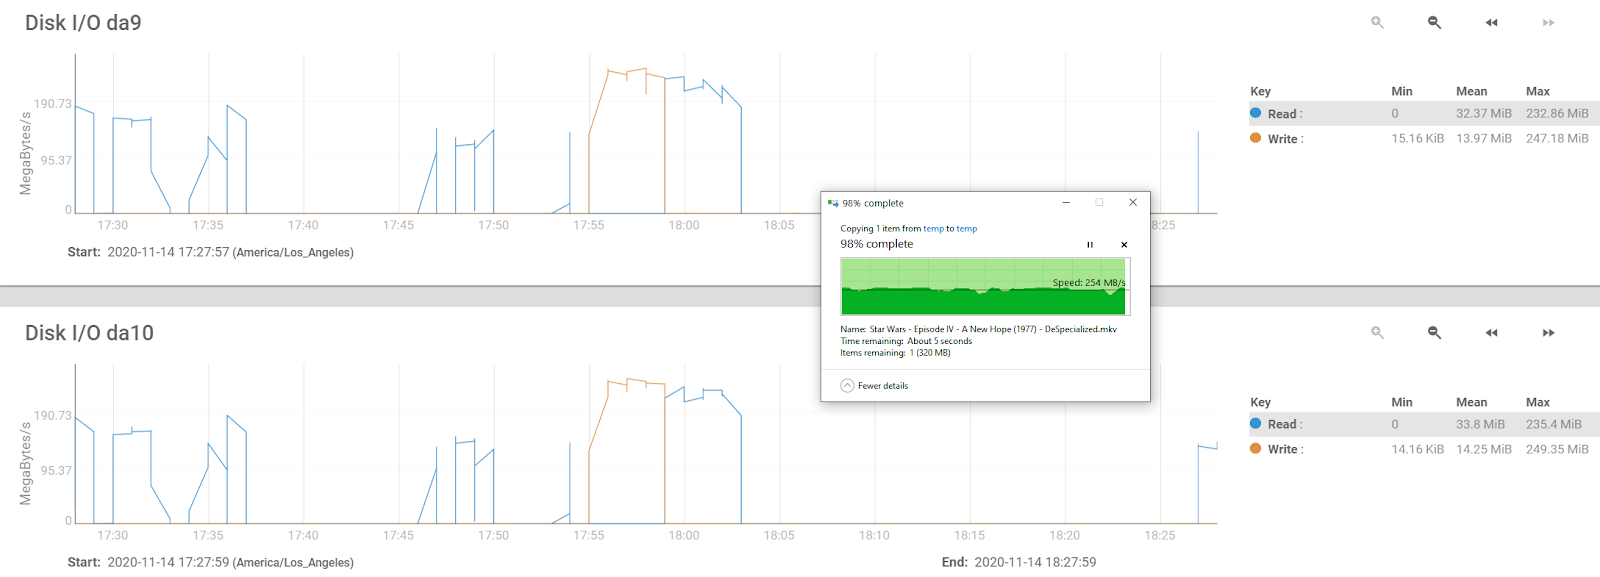
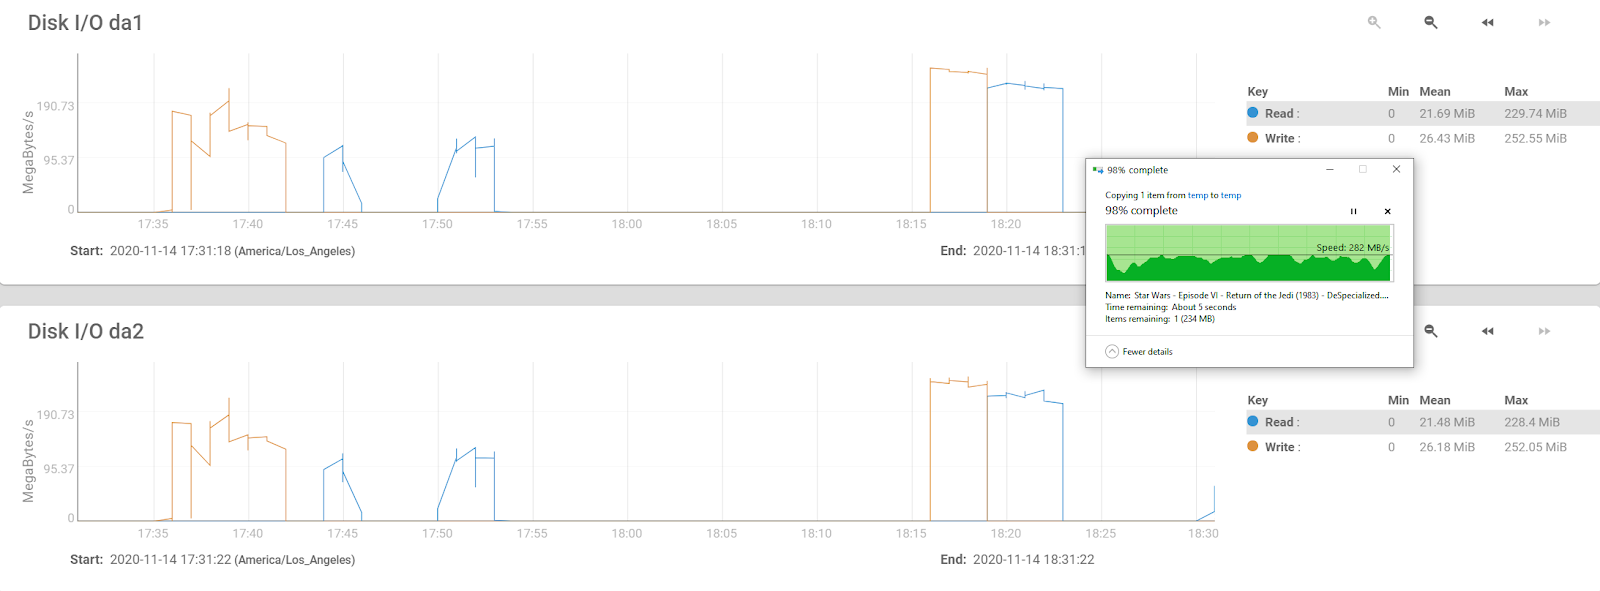
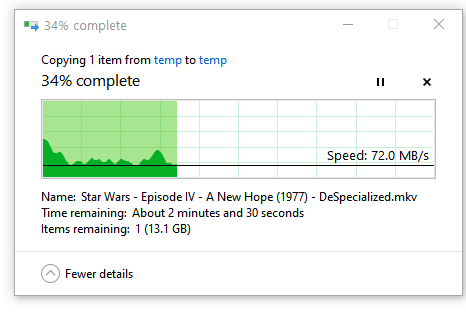
Thought I would do another copy from v02 to my PC and see how it does, as you can see, its only reading from 4 disks like v01.. but its reading at the full 280MB/s in total..

fio --name=testfile --rw=randrw --size=128G --direct=0
testfile: (groupid=0, jobs=1): err= 0: pid=23324: Tue Nov 10 08:23:18 2020
  read: IOPS=124, BW=496KiB/s (508kB/s)(321MiB/661780msec)
    clat (usec): min=4, max=331888, avg=7691.41, stdev=10975.89
     lat (usec): min=4, max=331889, avg=7691.60, stdev=10975.90
    clat percentiles (usec):
     |  1.00th=[     8],  5.00th=[    44], 10.00th=[    45], 20.00th=[    47],
     | 30.00th=[    59], 40.00th=[    62], 50.00th=[  7242], 60.00th=[  8979],
     | 70.00th=[  9896], 80.00th=[ 13698], 90.00th=[ 17433], 95.00th=[ 22152],
     | 99.00th=[ 43254], 99.50th=[ 67634], 99.90th=[128451], 99.95th=[152044],
     | 99.99th=[202376]
   bw (  KiB/s): min=   15, max=  833, per=99.92%, avg=495.62, stdev=164.49, samples=1256
   iops        : min=    3, max=  208, avg=123.52, stdev=41.13, samples=1256
  write: IOPS=123, BW=494KiB/s (506kB/s)(320MiB/661780msec)
    clat (usec): min=8, max=391259, avg=363.33, stdev=2939.81
     lat (usec): min=8, max=391259, avg=363.53, stdev=2939.81
    clat percentiles (usec):
     |  1.00th=[   15],  5.00th=[   42], 10.00th=[   48], 20.00th=[   50],
     | 30.00th=[   52], 40.00th=[   53], 50.00th=[   56], 60.00th=[   60],
     | 70.00th=[   65], 80.00th=[   68], 90.00th=[  429], 95.00th=[  474],
     | 99.00th=[11207], 99.50th=[17171], 99.90th=[28967], 99.95th=[34866],
     | 99.99th=[72877]
   bw (  KiB/s): min=    8, max=  959, per=99.94%, avg=493.70, stdev=174.90, samples=1256
   iops        : min=    2, max=  239, avg=123.06, stdev=43.75, samples=1256
  lat (usec)   : 10=0.81%, 20=1.75%, 50=18.76%, 100=44.19%, 250=1.14%
  lat (usec)   : 500=4.42%, 750=0.32%, 1000=0.04%
  lat (msec)   : 2=0.01%, 4=0.10%, 10=13.01%, 20=12.03%, 50=3.01%
  lat (msec)   : 100=0.31%, 250=0.09%, 500=0.01%
  cpu          : usr=0.06%, sys=2.14%, ctx=48455, majf=0, minf=0
  IO depths    : 1=100.0%, 2=0.0%, 4=0.0%, 8=0.0%, 16=0.0%, 32=0.0%, >=64=0.0%
     submit    : 0=0.0%, 4=100.0%, 8=0.0%, 16=0.0%, 32=0.0%, 64=0.0%, >=64=0.0%
     complete  : 0=0.0%, 4=100.0%, 8=0.0%, 16=0.0%, 32=0.0%, 64=0.0%, >=64=0.0%
     issued rwts: total=82133,81804,0,0 short=0,0,0,0 dropped=0,0,0,0
     latency   : target=0, window=0, percentile=100.00%, depth=1

Run status group 0 (all jobs):
   READ: bw=496KiB/s (508kB/s), 496KiB/s-496KiB/s (508kB/s-508kB/s), io=321MiB (336MB), run=661780-661780msec
  WRITE: bw=494KiB/s (506kB/s), 494KiB/s-494KiB/s (506kB/s-506kB/s), io=320MiB (335MB), run=661780-661780msec
testfile: (groupid=0, jobs=1): err= 0: pid=23586: Tue Nov 10 08:34:14 2020
  read: IOPS=93, BW=372KiB/s (381kB/s)(71.0MiB/197918msec)
    clat (usec): min=5, max=308876, avg=9512.76, stdev=14229.64
     lat (usec): min=5, max=308876, avg=9512.95, stdev=14229.65
    clat percentiles (usec):
     |  1.00th=[     8],  5.00th=[    44], 10.00th=[    45], 20.00th=[    46],
     | 30.00th=[    59], 40.00th=[    61], 50.00th=[  8455], 60.00th=[ 10814],
     | 70.00th=[ 12256], 80.00th=[ 18220], 90.00th=[ 22938], 95.00th=[ 28181],
     | 99.00th=[ 44303], 99.50th=[ 84411], 99.90th=[164627], 99.95th=[208667],
     | 99.99th=[283116]
   bw (  KiB/s): min=   23, max=  660, per=99.93%, avg=371.75, stdev=126.09, samples=374
   iops        : min=    5, max=  165, avg=92.56, stdev=31.53, samples=374
  write: IOPS=93, BW=373KiB/s (382kB/s)(72.0MiB/197918msec)
    clat (usec): min=11, max=202848, avg=1223.38, stdev=5500.77
     lat (usec): min=11, max=202848, avg=1223.58, stdev=5500.78
    clat percentiles (usec):
     |  1.00th=[    15],  5.00th=[    48], 10.00th=[    50], 20.00th=[    52],
     | 30.00th=[    55], 40.00th=[    61], 50.00th=[    64], 60.00th=[    65],
     | 70.00th=[    67], 80.00th=[    73], 90.00th=[   482], 95.00th=[  9765],
     | 99.00th=[ 20055], 99.50th=[ 23200], 99.90th=[ 68682], 99.95th=[114820],
     | 99.99th=[183501]
   bw (  KiB/s): min=   38, max=  793, per=100.00%, avg=372.29, stdev=132.42, samples=374
   iops        : min=    9, max=  198, avg=92.70, stdev=33.13, samples=374
  lat (usec)   : 10=0.86%, 20=1.63%, 50=14.44%, 100=47.14%, 250=1.51%
  lat (usec)   : 500=3.50%, 750=0.20%, 1000=0.01%
  lat (msec)   : 2=0.05%, 4=0.21%, 10=5.79%, 20=16.27%, 50=7.88%
  lat (msec)   : 100=0.29%, 250=0.20%, 500=0.02%
  cpu          : usr=0.05%, sys=1.56%, ctx=12752, majf=0, minf=0
  IO depths    : 1=100.0%, 2=0.0%, 4=0.0%, 8=0.0%, 16=0.0%, 32=0.0%, >=64=0.0%
     submit    : 0=0.0%, 4=100.0%, 8=0.0%, 16=0.0%, 32=0.0%, 64=0.0%, >=64=0.0%
     complete  : 0=0.0%, 4=100.0%, 8=0.0%, 16=0.0%, 32=0.0%, 64=0.0%, >=64=0.0%
     issued rwts: total=18426,18439,0,0 short=0,0,0,0 dropped=0,0,0,0
     latency   : target=0, window=0, percentile=100.00%, depth=1

Run status group 0 (all jobs):
   READ: bw=372KiB/s (381kB/s), 372KiB/s-372KiB/s (381kB/s-381kB/s), io=71.0MiB (75.5MB), run=197918-197918msec
  WRITE: bw=373KiB/s (382kB/s), 373KiB/s-373KiB/s (382kB/s-382kB/s), io=72.0MiB (75.5MB), run=197918-197918msec
testfile: (groupid=0, jobs=1): err= 0: pid=53463: Tue Nov 10 08:25:07 2020
  read: IOPS=53, BW=215KiB/s (220kB/s)(52.7MiB/250846msec)
    clat (usec): min=3, max=551098, avg=16982.49, stdev=15168.91
     lat (usec): min=3, max=551098, avg=16982.81, stdev=15168.88
    clat percentiles (usec):
     |  1.00th=[    20],  5.00th=[    25], 10.00th=[    34], 20.00th=[  9372],
     | 30.00th=[ 10421], 40.00th=[ 11469], 50.00th=[ 15533], 60.00th=[ 17957],
     | 70.00th=[ 20317], 80.00th=[ 23987], 90.00th=[ 29754], 95.00th=[ 36439],
     | 99.00th=[ 63701], 99.50th=[ 99091], 99.90th=[168821], 99.95th=[189793],
     | 99.99th=[231736]
   bw (  KiB/s): min=    7, max=  353, per=99.89%, avg=214.77, stdev=67.45, samples=488
   iops        : min=    1, max=   88, avg=53.31, stdev=16.92, samples=488
  write: IOPS=53, BW=215KiB/s (220kB/s)(52.7MiB/250846msec)
    clat (usec): min=5, max=373049, avg=1598.51, stdev=7057.09
     lat (usec): min=5, max=373049, avg=1598.82, stdev=7057.11
    clat percentiles (usec):
     |  1.00th=[    10],  5.00th=[    25], 10.00th=[    28], 20.00th=[    31],
     | 30.00th=[    33], 40.00th=[    47], 50.00th=[    69], 60.00th=[    75],
     | 70.00th=[    84], 80.00th=[   176], 90.00th=[  3851], 95.00th=[ 11338],
     | 99.00th=[ 22938], 99.50th=[ 32637], 99.90th=[ 74974], 99.95th=[110625],
     | 99.99th=[242222]
   bw (  KiB/s): min=    7, max=  458, per=99.97%, avg=214.94, stdev=74.80, samples=488
   iops        : min=    1, max=  114, avg=53.33, stdev=18.74, samples=488
  lat (usec)   : 4=0.02%, 10=0.76%, 20=0.85%, 50=26.04%, 100=14.70%
  lat (usec)   : 250=6.71%, 500=0.81%, 750=0.66%, 1000=0.51%
  lat (msec)   : 2=0.14%, 4=0.18%, 10=8.14%, 20=24.45%, 50=15.05%
  lat (msec)   : 100=0.70%, 250=0.27%, 500=0.01%, 750=0.01%
  cpu          : usr=0.06%, sys=0.82%, ctx=15538, majf=0, minf=0
  IO depths    : 1=100.0%, 2=0.0%, 4=0.0%, 8=0.0%, 16=0.0%, 32=0.0%, >=64=0.0%
     submit    : 0=0.0%, 4=100.0%, 8=0.0%, 16=0.0%, 32=0.0%, 64=0.0%, >=64=0.0%
     complete  : 0=0.0%, 4=100.0%, 8=0.0%, 16=0.0%, 32=0.0%, 64=0.0%, >=64=0.0%
     issued rwts: total=13490,13498,0,0 short=0,0,0,0 dropped=0,0,0,0
     latency   : target=0, window=0, percentile=100.00%, depth=1

Run status group 0 (all jobs):
   READ: bw=215KiB/s (220kB/s), 215KiB/s-215KiB/s (220kB/s-220kB/s), io=52.7MiB (55.3MB), run=250846-250846msec
  WRITE: bw=215KiB/s (220kB/s), 215KiB/s-215KiB/s (220kB/s-220kB/s), io=52.7MiB (55.3MB), run=250846-250846msec
Starting 1 process
seqread: Laying out IO file (1 file / 131072MiB)
Jobs: 1 (f=1): [R(1)][100.0%][r=338MiB/s][r=2705 IOPS][eta 00m:00s]
seqread: (groupid=0, jobs=1): err= 0: pid=47477: Tue Nov 10 18:14:13 2020
  read: IOPS=3355, BW=419MiB/s (440MB/s)(128GiB/312534msec)
    clat (usec): min=31, max=117827, avg=296.35, stdev=2856.28
     lat (usec): min=32, max=117827, avg=296.54, stdev=2856.28
    clat percentiles (usec):
     |  1.00th=[   62],  5.00th=[   64], 10.00th=[   66], 20.00th=[   69],
     | 30.00th=[   76], 40.00th=[   81], 50.00th=[   83], 60.00th=[   86],
     | 70.00th=[   91], 80.00th=[   98], 90.00th=[  108], 95.00th=[  145],
     | 99.00th=[ 2343], 99.50th=[ 7373], 99.90th=[54789], 99.95th=[63177],
     | 99.99th=[82314]
   bw (  KiB/s): min=134095, max=898804, per=100.00%, avg=430635.26, stdev=133197.72, samples=604
   iops        : min= 1047, max= 7021, avg=3363.85, stdev=1040.59, samples=604
  lat (usec)   : 50=0.04%, 100=82.33%, 250=13.34%, 500=1.16%, 750=1.20%
  lat (usec)   : 1000=0.22%
  lat (msec)   : 2=0.59%, 4=0.39%, 10=0.30%, 20=0.11%, 50=0.19%
  lat (msec)   : 100=0.13%, 250=0.01%
  cpu          : usr=0.75%, sys=31.07%, ctx=27033, majf=0, minf=33
  IO depths    : 1=100.0%, 2=0.0%, 4=0.0%, 8=0.0%, 16=0.0%, 32=0.0%, >=64=0.0%
     submit    : 0=0.0%, 4=100.0%, 8=0.0%, 16=0.0%, 32=0.0%, 64=0.0%, >=64=0.0%
     complete  : 0=0.0%, 4=100.0%, 8=0.0%, 16=0.0%, 32=0.0%, 64=0.0%, >=64=0.0%
     issued rwts: total=1048576,0,0,0 short=0,0,0,0 dropped=0,0,0,0
     latency   : target=0, window=0, percentile=100.00%, depth=32

Run status group 0 (all jobs):
   READ: bw=419MiB/s (440MB/s), 419MiB/s-419MiB/s (440MB/s-440MB/s), io=128GiB (137GB), run=312534-312534msec
seqread: (g=0): rw=read, bs=(R) 128KiB-128KiB, (W) 128KiB-128KiB, (T) 128KiB-128KiB, ioengine=psync, iodepth=32
fio-3.19
Starting 1 process
seqread: Laying out IO file (1 file / 131072MiB)
Jobs: 1 (f=1): [R(1)][99.6%][r=472MiB/s][r=3774 IOPS][eta 00m:01s]
seqread: (groupid=0, jobs=1): err= 0: pid=49364: Tue Nov 10 18:27:58 2020
  read: IOPS=3694, BW=462MiB/s (484MB/s)(128GiB/283806msec)
    clat (usec): min=34, max=105955, avg=268.98, stdev=2855.54
     lat (usec): min=34, max=105955, avg=269.17, stdev=2855.54
    clat percentiles (usec):
     |  1.00th=[   49],  5.00th=[   55], 10.00th=[   57], 20.00th=[   59],
     | 30.00th=[   63], 40.00th=[   67], 50.00th=[   72], 60.00th=[   74],
     | 70.00th=[   78], 80.00th=[   82], 90.00th=[   87], 95.00th=[  109],
     | 99.00th=[ 1270], 99.50th=[ 5866], 99.90th=[55313], 99.95th=[63701],
     | 99.99th=[80217]
   bw (  KiB/s): min=136885, max=1199528, per=100.00%, avg=473505.34, stdev=168405.81, samples=542
   iops        : min= 1069, max= 9371, avg=3698.78, stdev=1315.67, samples=542
  lat (usec)   : 50=1.27%, 100=93.01%, 250=1.51%, 500=2.51%, 750=0.43%
  lat (usec)   : 1000=0.17%
  lat (msec)   : 2=0.24%, 4=0.19%, 10=0.25%, 20=0.07%, 50=0.20%
  lat (msec)   : 100=0.13%, 250=0.01%
  cpu          : usr=0.87%, sys=29.79%, ctx=21768, majf=0, minf=33
  IO depths    : 1=100.0%, 2=0.0%, 4=0.0%, 8=0.0%, 16=0.0%, 32=0.0%, >=64=0.0%
     submit    : 0=0.0%, 4=100.0%, 8=0.0%, 16=0.0%, 32=0.0%, 64=0.0%, >=64=0.0%
     complete  : 0=0.0%, 4=100.0%, 8=0.0%, 16=0.0%, 32=0.0%, 64=0.0%, >=64=0.0%
     issued rwts: total=1048576,0,0,0 short=0,0,0,0 dropped=0,0,0,0
     latency   : target=0, window=0, percentile=100.00%, depth=32

Run status group 0 (all jobs):
   READ: bw=462MiB/s (484MB/s), 462MiB/s-462MiB/s (484MB/s-484MB/s), io=128GiB (137GB), run=283806-283806msec
seqread: (g=0): rw=read, bs=(R) 128KiB-128KiB, (W) 128KiB-128KiB, (T) 128KiB-128KiB, ioengine=psync, iodepth=32
fio-3.19
Starting 1 process
seqread: Laying out IO file (1 file / 131072MiB)
Jobs: 1 (f=1): [R(1)][100.0%][r=507MiB/s][r=4055 IOPS][eta 00m:00s]
seqread: (groupid=0, jobs=1): err= 0: pid=50923: Tue Nov 10 18:49:14 2020
  read: IOPS=4240, BW=530MiB/s (556MB/s)(128GiB/247267msec)
    clat (usec): min=33, max=101551, avg=234.14, stdev=1982.05
     lat (usec): min=34, max=101551, avg=234.32, stdev=1982.05
    clat percentiles (usec):
     |  1.00th=[   52],  5.00th=[   54], 10.00th=[   55], 20.00th=[   57],
     | 30.00th=[   59], 40.00th=[   64], 50.00th=[   70], 60.00th=[   72],
     | 70.00th=[   74], 80.00th=[   77], 90.00th=[   83], 95.00th=[  109],
     | 99.00th=[ 2933], 99.50th=[ 4228], 99.90th=[38011], 99.95th=[51643],
     | 99.99th=[68682]
   bw (  KiB/s): min=187437, max=788549, per=100.00%, avg=543808.69, stdev=117484.05, samples=475
   iops        : min= 1464, max= 6160, avg=4248.04, stdev=917.84, samples=475
  lat (usec)   : 50=0.49%, 100=94.11%, 250=0.89%, 500=0.60%, 750=0.29%
  lat (usec)   : 1000=0.25%
  lat (msec)   : 2=1.03%, 4=1.78%, 10=0.34%, 20=0.06%, 50=0.11%
  lat (msec)   : 100=0.05%, 250=0.01%
  cpu          : usr=0.94%, sys=28.46%, ctx=49696, majf=0, minf=33
  IO depths    : 1=100.0%, 2=0.0%, 4=0.0%, 8=0.0%, 16=0.0%, 32=0.0%, >=64=0.0%
     submit    : 0=0.0%, 4=100.0%, 8=0.0%, 16=0.0%, 32=0.0%, 64=0.0%, >=64=0.0%
     complete  : 0=0.0%, 4=100.0%, 8=0.0%, 16=0.0%, 32=0.0%, 64=0.0%, >=64=0.0%
     issued rwts: total=1048576,0,0,0 short=0,0,0,0 dropped=0,0,0,0
     latency   : target=0, window=0, percentile=100.00%, depth=32

Run status group 0 (all jobs):
   READ: bw=530MiB/s (556MB/s), 530MiB/s-530MiB/s (556MB/s-556MB/s), io=128GiB (137GB), run=247267-247267msec
read
v01                                              128G  12.6T    282      0   253M      0
  gptid/1708f1f7-23b0-11eb-8965-000acd3aff72     128G  12.6T    282      0   253M      0

write

v01                                              114G  12.6T      0    250      0   250M
  gptid/1708f1f7-23b0-11eb-8965-000acd3aff72     114G  12.6T      0    250      0   250M
seqread: (g=0): rw=read, bs=(R) 128KiB-128KiB, (W) 128KiB-128KiB, (T) 128KiB-128KiB, ioengine=psync, iodepth=32
fio-3.19
Starting 1 process
seqread: Laying out IO file (1 file / 131072MiB)
Jobs: 1 (f=1): [R(1)][100.0%][r=234MiB/s][r=1875 IOPS][eta 00m:00s]
seqread: (groupid=0, jobs=1): err= 0: pid=52323: Tue Nov 10 19:13:11 2020
  read: IOPS=1926, BW=241MiB/s (253MB/s)(128GiB/544267msec)
    clat (usec): min=28, max=99262, avg=517.35, stdev=1583.01
     lat (usec): min=28, max=99262, avg=517.54, stdev=1583.01
    clat percentiles (usec):
     |  1.00th=[   38],  5.00th=[   48], 10.00th=[   52], 20.00th=[   54],
     | 30.00th=[   57], 40.00th=[   59], 50.00th=[   69], 60.00th=[   71],
     | 70.00th=[   73], 80.00th=[   78], 90.00th=[ 2343], 95.00th=[ 3458],
     | 99.00th=[ 6063], 99.50th=[ 6915], 99.90th=[17957], 99.95th=[27919],
     | 99.99th=[41681]
   bw (  KiB/s): min=169250, max=274779, per=100.00%, avg=246858.38, stdev=12438.44, samples=1044
   iops        : min= 1322, max= 2146, avg=1928.10, stdev=97.17, samples=1044
  lat (usec)   : 50=7.54%, 100=74.52%, 250=1.79%, 500=3.36%, 750=0.55%
  lat (usec)   : 1000=0.22%
  lat (msec)   : 2=1.74%, 4=8.29%, 10=1.76%, 20=0.16%, 50=0.07%
  lat (msec)   : 100=0.01%
  cpu          : usr=0.47%, sys=15.37%, ctx=132727, majf=0, minf=33
  IO depths    : 1=100.0%, 2=0.0%, 4=0.0%, 8=0.0%, 16=0.0%, 32=0.0%, >=64=0.0%
     submit    : 0=0.0%, 4=100.0%, 8=0.0%, 16=0.0%, 32=0.0%, 64=0.0%, >=64=0.0%
     complete  : 0=0.0%, 4=100.0%, 8=0.0%, 16=0.0%, 32=0.0%, 64=0.0%, >=64=0.0%
     issued rwts: total=1048576,0,0,0 short=0,0,0,0 dropped=0,0,0,0
     latency   : target=0, window=0, percentile=100.00%, depth=32

Run status group 0 (all jobs):
   READ: bw=241MiB/s (253MB/s), 241MiB/s-241MiB/s (253MB/s-253MB/s), io=128GiB (137GB), run=544267-544267msec
Try configuring the pool to use mirrors instead of raidz-2 as a test
Also you are using sequential testing which is not real world, you should be testing using random patterns. Your last fio test results looked great but they are not reality when you are transferring files. The only think I can think of is that I agree with you, those 14TB drives are the issue.
I have never seen such pattens on my servers.One question I will throw out to the community, anyone else running Raid Z2 with 6 drives, do you see a consistent read speed across all drives or do you only see 4 drives being read from at a time, because that's what I am seeing :(
I hope not. He states that they are DC HC530 drives which are data center class.Can it be that your 14Tb drives are shingled ?
Starting 1 process

seqread: Laying out IO file (1 file / 98304MiB)

Jobs: 1 (f=1): [R(1)][100.0%][r=453MiB/s][r=3622 IOPS][eta 00m:00s]

seqread: (groupid=0, jobs=1): err= 0: pid=12114: Sat Nov 14 18:03:05 2020

  read: IOPS=3558, BW=445MiB/s (466MB/s)(96.0GiB/221005msec)

    clat (usec): min=30, max=90886, avg=279.28, stdev=1221.63

     lat (usec): min=30, max=90886, avg=279.48, stdev=1221.63

    clat percentiles (usec):

     |  1.00th=[   40],  5.00th=[   51], 10.00th=[   53], 20.00th=[   55],

     | 30.00th=[   57], 40.00th=[   59], 50.00th=[   69], 60.00th=[   71],

     | 70.00th=[   73], 80.00th=[   75], 90.00th=[  235], 95.00th=[ 1958],

     | 99.00th=[ 3425], 99.50th=[ 3884], 99.90th=[18220], 99.95th=[24511],

     | 99.99th=[41681]

   bw (  KiB/s): min=85013, max=1570711, per=100.00%, avg=455833.19, stdev=85229.79, samples=426

   iops        : min=  664, max=12271, avg=3560.69, stdev=665.85, samples=426

  lat (usec)   : 50=4.84%, 100=84.33%, 250=0.91%, 500=2.89%, 750=0.76%

  lat (usec)   : 1000=0.26%

  lat (msec)   : 2=1.06%, 4=4.55%, 10=0.20%, 20=0.11%, 50=0.08%

  lat (msec)   : 100=0.01%

  cpu          : usr=0.85%, sys=28.24%, ctx=53895, majf=0, minf=33

  IO depths    : 1=100.0%, 2=0.0%, 4=0.0%, 8=0.0%, 16=0.0%, 32=0.0%, >=64=0.0%

     submit    : 0=0.0%, 4=100.0%, 8=0.0%, 16=0.0%, 32=0.0%, 64=0.0%, >=64=0.0%

     complete  : 0=0.0%, 4=100.0%, 8=0.0%, 16=0.0%, 32=0.0%, 64=0.0%, >=64=0.0%

     issued rwts: total=786432,0,0,0 short=0,0,0,0 dropped=0,0,0,0

     latency   : target=0, window=0, percentile=100.00%, depth=32


Run status group 0 (all jobs):

   READ: bw=445MiB/s (466MB/s), 445MiB/s-445MiB/s (466MB/s-466MB/s), io=96.0GiB (103GB), run=221005-221005msec
seqread: (g=0): rw=read, bs=(R) 128KiB-128KiB, (W) 128KiB-128KiB, (T) 128KiB-128KiB, ioengine=psync, iodepth=32

fio-3.19

Starting 1 process

seqread: Laying out IO file (1 file / 98304MiB)

Jobs: 1 (f=1): [R(1)][100.0%][r=425MiB/s][r=3399 IOPS][eta 00m:00s]

seqread: (groupid=0, jobs=1): err= 0: pid=12440: Sat Nov 14 18:23:08 2020

  read: IOPS=3507, BW=438MiB/s (460MB/s)(96.0GiB/224191msec)

    clat (usec): min=29, max=102282, avg=283.34, stdev=1441.25

     lat (usec): min=30, max=102282, avg=283.55, stdev=1441.25

    clat percentiles (usec):

     |  1.00th=[   40],  5.00th=[   50], 10.00th=[   53], 20.00th=[   55],

     | 30.00th=[   57], 40.00th=[   59], 50.00th=[   69], 60.00th=[   71],

     | 70.00th=[   73], 80.00th=[   76], 90.00th=[  231], 95.00th=[ 1319],

     | 99.00th=[ 3589], 99.50th=[ 5932], 99.90th=[20055], 99.95th=[27132],

     | 99.99th=[57410]

   bw (  KiB/s): min=213413, max=538360, per=100.00%, avg=449786.34, stdev=45045.23, samples=432

   iops        : min= 1667, max= 4205, avg=3513.48, stdev=351.90, samples=432

  lat (usec)   : 50=5.11%, 100=84.03%, 250=1.13%, 500=2.47%, 750=1.26%

  lat (usec)   : 1000=0.73%

  lat (msec)   : 2=1.00%, 4=3.44%, 10=0.63%, 20=0.11%, 50=0.08%

  lat (msec)   : 100=0.02%, 250=0.01%

  cpu          : usr=0.78%, sys=28.30%, ctx=52499, majf=0, minf=33

  IO depths    : 1=100.0%, 2=0.0%, 4=0.0%, 8=0.0%, 16=0.0%, 32=0.0%, >=64=0.0%

     submit    : 0=0.0%, 4=100.0%, 8=0.0%, 16=0.0%, 32=0.0%, 64=0.0%, >=64=0.0%

     complete  : 0=0.0%, 4=100.0%, 8=0.0%, 16=0.0%, 32=0.0%, 64=0.0%, >=64=0.0%

     issued rwts: total=786432,0,0,0 short=0,0,0,0 dropped=0,0,0,0

     latency   : target=0, window=0, percentile=100.00%, depth=32


Run status group 0 (all jobs):

   READ: bw=438MiB/s (460MB/s), 438MiB/s-438MiB/s (460MB/s-460MB/s), io=96.0GiB (103GB), run=224191-224191msec
seqread: (g=0): rw=read, bs=(R) 128KiB-128KiB, (W) 128KiB-128KiB, (T) 128KiB-128KiB, ioengine=psync, iodepth=32

fio-3.19

Starting 1 process

seqread: Laying out IO file (1 file / 98304MiB)

Jobs: 1 (f=1): [R(1)][99.7%][r=286MiB/s][r=2291 IOPS][eta 00m:01s]

seqread: (groupid=0, jobs=1): err= 0: pid=12263: Sat Nov 14 18:15:13 2020

  read: IOPS=2336, BW=292MiB/s (306MB/s)(96.0GiB/336555msec)

    clat (usec): min=29, max=289569, avg=426.20, stdev=1554.43

     lat (usec): min=29, max=289569, avg=426.41, stdev=1554.43

    clat percentiles (usec):

     |  1.00th=[   39],  5.00th=[   49], 10.00th=[   53], 20.00th=[   55],

     | 30.00th=[   57], 40.00th=[   60], 50.00th=[   69], 60.00th=[   71],

     | 70.00th=[   73], 80.00th=[   76], 90.00th=[  461], 95.00th=[ 4015],

     | 99.00th=[ 6128], 99.50th=[ 7373], 99.90th=[16450], 99.95th=[21890],

     | 99.99th=[31589]

   bw (  KiB/s): min=173473, max=342095, per=100.00%, avg=299401.93, stdev=18991.41, samples=645

   iops        : min= 1355, max= 2672, avg=2338.58, stdev=148.36, samples=645

  lat (usec)   : 50=6.02%, 100=81.38%, 250=2.02%, 500=2.65%, 750=1.14%

  lat (usec)   : 1000=0.15%

  lat (msec)   : 2=0.26%, 4=1.36%, 10=4.76%, 20=0.19%, 50=0.06%

  lat (msec)   : 100=0.01%, 250=0.01%, 500=0.01%

  cpu          : usr=0.63%, sys=19.57%, ctx=56304, majf=0, minf=33

  IO depths    : 1=100.0%, 2=0.0%, 4=0.0%, 8=0.0%, 16=0.0%, 32=0.0%, >=64=0.0%

     submit    : 0=0.0%, 4=100.0%, 8=0.0%, 16=0.0%, 32=0.0%, 64=0.0%, >=64=0.0%

     complete  : 0=0.0%, 4=100.0%, 8=0.0%, 16=0.0%, 32=0.0%, 64=0.0%, >=64=0.0%

     issued rwts: total=786432,0,0,0 short=0,0,0,0 dropped=0,0,0,0

     latency   : target=0, window=0, percentile=100.00%, depth=32


Run status group 0 (all jobs):

   READ: bw=292MiB/s (306MB/s), 292MiB/s-292MiB/s (306MB/s-306MB/s), io=96.0GiB (103GB), run=336555-336555msec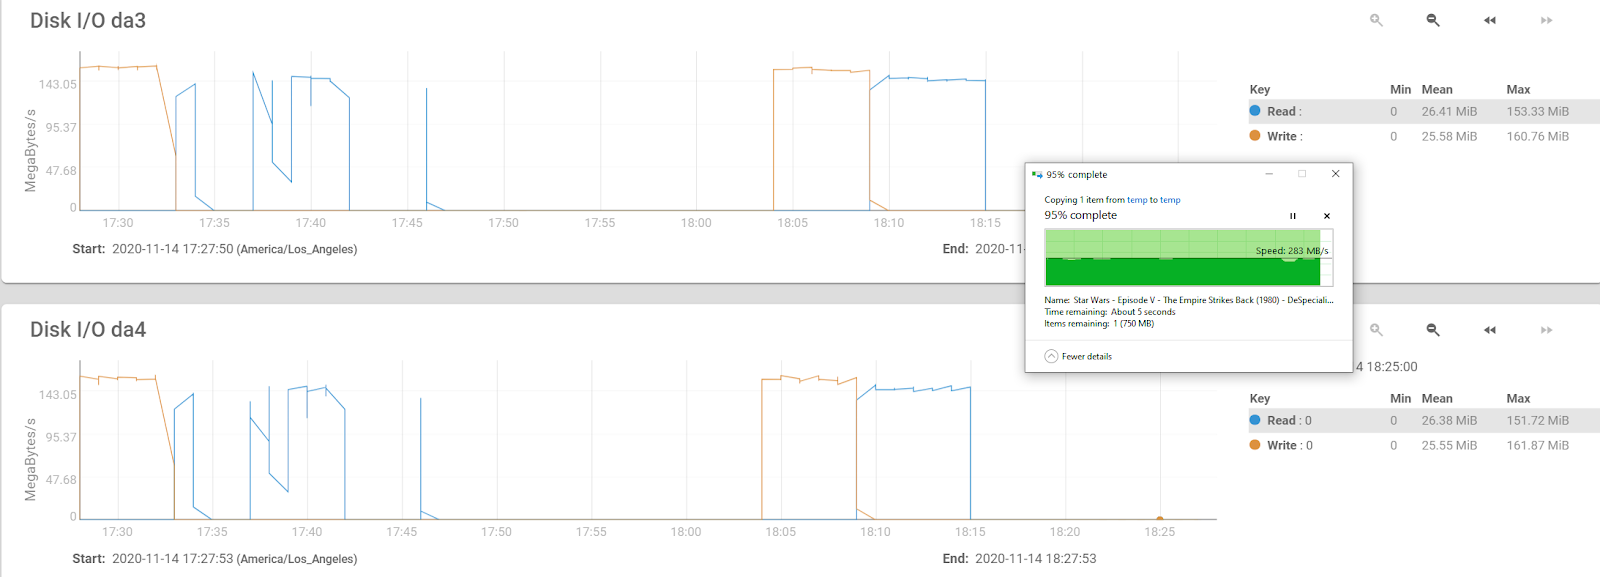


Wow, I recall when this came out, it was a pain in the rear and I had to use a power adapter to make my drives work. If forget the drive model I had, it seamed like forever ago. I eventually replaced the power supply (gave me an excuse to upgrade). So it's not a terribly expensive fix and then I retained the power supply for other projects and I'm sure it's in the garage just waiting to be used as a test subject.Well I finally figured out why these WD HC530 drives couldn't be detected in my backup NAS... apparently they have what's called a power disable "feature" that prevents them from booting on some hardware (http://web.archive.org/web/20161121...files/resources/HGST-Power-Disable-Pin-TB.pdf)
Wow, I recall when this came out, it was a pain in the rear and I had to use a power adapter to make my drives work. If forget the drive model I had, it seamed like forever ago. I eventually replaced the power supply (gave me an excuse to upgrade). So it's not a terribly expensive fix and then I retained the power supply for other projects and I'm sure it's in the garage just waiting to be used as a test subject.
What versions of FreeNAS/TrueNAS have you tried? Someone else I was working with has a significant difference between FreeNAS 11.3-U5 and TrueNAS 12.0-Release. They should have submitted a bug report by now and rolled back to FreeNAS 11.3-U5 to restore performance. Mind you that they also had high speed ethernet so they were able to see the problem. I could not verify the problem as I only have 1Gbps Ethernet. Unfortunately this person had updated their pools to the new ZFS so they had to backup all the data and destroy the pool and recreate it under FreeNAS 11.3-U5, then restore the data. I cautioned them to never update the ZFS pool unless you absolutely need to.
Good luck.
Starting 1 process
seqread: Laying out IO file (1 file / 131072MiB)
Jobs: 1 (f=1): [R(1)][100.0%][r=639MiB/s][r=5111 IOPS][eta 00m:00s]
seqread: (groupid=0, jobs=1): err= 0: pid=3330: Tue Nov 17 05:56:45 2020
  read: IOPS=5034, BW=629MiB/s (660MB/s)(128GiB/208285msec)
    clat (usec): min=41, max=428836, avg=197.01, stdev=1857.81
     lat (usec): min=42, max=428837, avg=197.19, stdev=1857.81
    clat percentiles (usec):
     |  1.00th=[   59],  5.00th=[   61], 10.00th=[   63], 20.00th=[   66],
     | 30.00th=[   73], 40.00th=[   76], 50.00th=[   79], 60.00th=[   82],
     | 70.00th=[   87], 80.00th=[   92], 90.00th=[   98], 95.00th=[  120],
     | 99.00th=[ 1975], 99.50th=[ 3261], 99.90th=[25560], 99.95th=[43779],
     | 99.99th=[65274]
   bw (  KiB/s): min=82011, max=1043672, per=99.49%, avg=641078.63, stdev=269007.58, samples=416
   iops        : min=  640, max= 8153, avg=5008.00, stdev=2101.60, samples=416
  lat (usec)   : 50=0.01%, 100=91.35%, 250=5.20%, 500=0.49%, 750=0.27%
  lat (usec)   : 1000=0.32%
  lat (msec)   : 2=1.38%, 4=0.55%, 10=0.21%, 20=0.09%, 50=0.09%
  lat (msec)   : 100=0.03%, 250=0.01%, 500=0.01%
  cpu          : usr=1.11%, sys=39.82%, ctx=33691, majf=0, minf=32
  IO depths    : 1=100.0%, 2=0.0%, 4=0.0%, 8=0.0%, 16=0.0%, 32=0.0%, >=64=0.0%
     submit    : 0=0.0%, 4=100.0%, 8=0.0%, 16=0.0%, 32=0.0%, 64=0.0%, >=64=0.0%
     complete  : 0=0.0%, 4=100.0%, 8=0.0%, 16=0.0%, 32=0.0%, 64=0.0%, >=64=0.0%
     issued rwts: total=1048576,0,0,0 short=0,0,0,0 dropped=0,0,0,0
     latency   : target=0, window=0, percentile=100.00%, depth=32

Run status group 0 (all jobs):
   READ: bw=629MiB/s (660MB/s), 629MiB/s-629MiB/s (660MB/s-660MB/s), io=128GiB (137GB), run=208285-208285msec