11.2 - pool status confusion

Status
Not open for further replies.

danb35

Hall of Famer
Joined
Aug 16, 2011
Messages
15,504
I've started having some trouble with da0 in my system--a few bad sectors, messages in the daily security report below, etc.
Code:
(da0:mps0:0:8:0): READ(10). CDB: 28 00 d5 46 1a e8 00 00 10 00
(da0:mps0:0:8:0): CAM status: SCSI Status Error
(da0:mps0:0:8:0): SCSI status: Check Condition
(da0:mps0:0:8:0): SCSI sense: MEDIUM ERROR asc:11,0 (Unrecovered read error)
(da0:mps0:0:8:0): Info: 0xd5461ae8
(da0:mps0:0:8:0): Error 5, Unretryable error

I have a replacement on the way and will get it replaced. What's confusing me, though, is the pool status. If I check at the shell, I get this:
Code:
root@freenas2:~ # zpool status tank
  pool: tank
state: ONLINE
  scan: scrub repaired 5.98M in 1 days 00:17:22 with 0 errors on Tue Dec 18 00:19:04 2018
config:

    NAME                                            STATE     READ WRITE CKSUM
    tank                                            ONLINE       0     0     0
      raidz2-0                                      ONLINE       0     0     0
        gptid/9a85d15f-8d5c-11e4-8732-0cc47a01304d  ONLINE       0     0     0
        gptid/9afa89ae-8d5c-11e4-8732-0cc47a01304d  ONLINE       0     0     0
        gptid/9b6cc00b-8d5c-11e4-8732-0cc47a01304d  ONLINE       0     0     0
        gptid/9c501d57-8d5c-11e4-8732-0cc47a01304d  ONLINE       0     0     0
        gptid/9cc41939-8d5c-11e4-8732-0cc47a01304d  ONLINE       0     0     0
        gptid/9d39e31d-8d5c-11e4-8732-0cc47a01304d  ONLINE       0     0     0
      raidz2-1                                      ONLINE       0     0     0
        gptid/f5b737a6-8e41-11e4-8732-0cc47a01304d  ONLINE       0     0     0
        gptid/7e2d9269-8a4e-11e5-bec2-002590de8695  ONLINE       0     0     0
        gptid/f68f4fa9-8e41-11e4-8732-0cc47a01304d  ONLINE       0     0     0
        gptid/f722e509-8e41-11e4-8732-0cc47a01304d  ONLINE       0     0     0
        gptid/56c2074c-657f-11e6-877d-002590caf340  ONLINE       0     0     0
        gptid/82d5cbf5-2a41-11e6-a151-002590caf340  ONLINE       0     0     0
      raidz2-2                                      ONLINE       0     0     0
        gptid/2c854638-212c-11e6-881c-002590caf340  ONLINE       0     0     0
        gptid/2dc4f155-212c-11e6-881c-002590caf340  ONLINE       0     0     0
        gptid/b7625ade-6980-11e6-877d-002590caf340  ONLINE       0     0     0
        gptid/1abefcac-acb9-11e6-8df3-002590caf340  ONLINE       0     0     0
        gptid/3d317e50-67dd-11e6-877d-002590caf340  ONLINE       0     0     0
        gptid/192328aa-fc8e-11e6-aef3-002590caf340  ONLINE       0     0     0

errors: No known data errors


In the GUI, though, I get this from the relevant vdev:
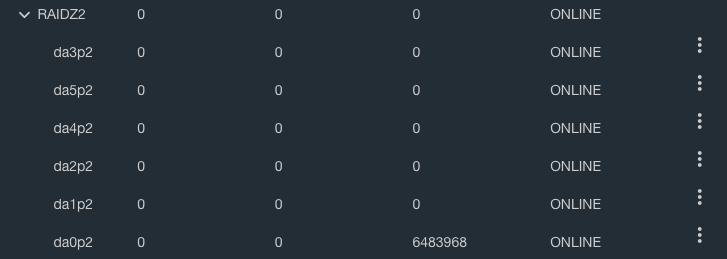
1545166011893.png

The columns are, of course, the same as in the CLI output, so the figure of 6.4M is checksum errors on da0.

I'm kind of confused by the apparent discrepancy. SMART errors not being reflected in zpool status is nothing new, of course, but one pool status output showing no errors, and a different output showing 6.4 million, seems like a significant issue. Thoughts?

Edit: I don't think hardware is really relevant here, but in case it is and you can't see my sig, here it is:
FreeNAS 11.2
SuperMicro SuperStorage Server 6047R-E1R36L (Motherboard: X9DRD-7LN4F-JBOD, Chassis: SuperChassis 847E16-R1K28LPB)
2 x Xeon E5-2670, 128 GB RAM, Chelsio T420E-CR
Pool: 6 x 6 TB RAIDZ2, 6 x 4 TB RAIDZ2, (2 x 2 TB + 4 x 3 TB) RAIDZ2

All the spinners are connected via a SAS2 expander backplane to the onboard LSI 2308 controller.
 

joeschmuck

Old Man
Moderator
Joined
May 28, 2011
Messages
10,994
That is a weird discrepancy. I hope that it records all the errors on a specific drive and holds that value until after you have viewed/reset it. Can you edit/reset the values in the GUI? What happens if you run zpool clear tank ??? Does that clear the GUI?
 

Chris Moore

Hall of Famer
Joined
May 2, 2015
Messages
10,080
I would say that the discrepancy is a bug. There shouldn't be a difference. Out of curiosity, what kind of drive is throwing the error?
 

joeschmuck

Old Man
Moderator
Joined
May 28, 2011
Messages
10,994
I would say that the discrepancy is a bug. There shouldn't be a difference. Out of curiosity, what kind of drive is throwing the error?
In my office we call it a "Feature" ;)
 

danb35

Hall of Famer
Joined
Aug 16, 2011
Messages
15,504
The drive is an old WD Green 2 TB. For morbid curiosity, here's the SMART output:
Code:
root@freenas2:~ # smartctl -x /dev/da0
smartctl 6.6 2017-11-05 r4594 [FreeBSD 11.2-STABLE amd64] (local build)
Copyright (C) 2002-17, Bruce Allen, Christian Franke, www.smartmontools.org

=== START OF INFORMATION SECTION ===
Model Family:     Western Digital Green
Device Model:     WDC WD20EARX-008FB0
Serial Number:    WD-WCAZAJ685519
LU WWN Device Id: 5 0014ee 25cf33390
Firmware Version: 51.0AB51
User Capacity:    2,000,398,934,016 bytes [2.00 TB]
Sector Sizes:     512 bytes logical, 4096 bytes physical
Device is:        In smartctl database [for details use: -P show]
ATA Version is:   ATA8-ACS (minor revision not indicated)
SATA Version is:  SATA 3.0, 6.0 Gb/s (current: 6.0 Gb/s)
Local Time is:    Tue Dec 18 16:49:26 2018 EST
SMART support is: Available - device has SMART capability.
SMART support is: Enabled
AAM feature is:   Unavailable
APM feature is:   Unavailable
Rd look-ahead is: Enabled
Write cache is:   Enabled
DSN feature is:   Unavailable
ATA Security is:  Disabled, NOT FROZEN [SEC1]
Wt Cache Reorder: Enabled

=== START OF READ SMART DATA SECTION ===
SMART overall-health self-assessment test result: PASSED

General SMART Values:
Offline data collection status:  (0x84)    Offline data collection activity
                    was suspended by an interrupting command from host.
                    Auto Offline Data Collection: Enabled.
Self-test execution status:      (   0)    The previous self-test routine completed
                    without error or no self-test has ever 
                    been run.
Total time to complete Offline 
data collection:         (36480) seconds.
Offline data collection
capabilities:              (0x7b) SMART execute Offline immediate.
                    Auto Offline data collection on/off support.
                    Suspend Offline collection upon new
                    command.
                    Offline surface scan supported.
                    Self-test supported.
                    Conveyance Self-test supported.
                    Selective Self-test supported.
SMART capabilities:            (0x0003)    Saves SMART data before entering
                    power-saving mode.
                    Supports SMART auto save timer.
Error logging capability:        (0x01)    Error logging supported.
                    General Purpose Logging supported.
Short self-test routine 
recommended polling time:      (   2) minutes.
Extended self-test routine
recommended polling time:      ( 392) minutes.
Conveyance self-test routine
recommended polling time:      (   5) minutes.
SCT capabilities:            (0x30b5)    SCT Status supported.
                    SCT Feature Control supported.
                    SCT Data Table supported.

SMART Attributes Data Structure revision number: 16
Vendor Specific SMART Attributes with Thresholds:
ID# ATTRIBUTE_NAME          FLAGS    VALUE WORST THRESH FAIL RAW_VALUE
  1 Raw_Read_Error_Rate     POSR-K   200   200   051    -    69
  3 Spin_Up_Time            POS--K   185   184   021    -    5716
  4 Start_Stop_Count        -O--CK   097   097   000    -    3092
  5 Reallocated_Sector_Ct   PO--CK   200   200   140    -    0
  7 Seek_Error_Rate         -OSR-K   200   200   000    -    0
  9 Power_On_Hours          -O--CK   049   049   000    -    37713
 10 Spin_Retry_Count        -O--CK   100   100   000    -    0
 11 Calibration_Retry_Count -O--CK   100   253   000    -    0
 12 Power_Cycle_Count       -O--CK   100   100   000    -    90
192 Power-Off_Retract_Count -O--CK   200   200   000    -    64
193 Load_Cycle_Count        -O--CK   188   188   000    -    38496
194 Temperature_Celsius     -O---K   124   107   000    -    26
196 Reallocated_Event_Count -O--CK   200   200   000    -    0
197 Current_Pending_Sector  -O--CK   200   200   000    -    4
198 Offline_Uncorrectable   ----CK   200   200   000    -    0
199 UDMA_CRC_Error_Count    -O--CK   200   200   000    -    0
200 Multi_Zone_Error_Rate   ---R--   200   200   000    -    0
                            ||||||_ K auto-keep
                            |||||__ C event count
                            ||||___ R error rate
                            |||____ S speed/performance
                            ||_____ O updated online
                            |______ P prefailure warning

General Purpose Log Directory Version 1
SMART           Log Directory Version 1 [multi-sector log support]
Address    Access  R/W   Size  Description
0x00       GPL,SL  R/O      1  Log Directory
0x01           SL  R/O      1  Summary SMART error log
0x02           SL  R/O      5  Comprehensive SMART error log
0x03       GPL     R/O      6  Ext. Comprehensive SMART error log
0x06           SL  R/O      1  SMART self-test log
0x07       GPL     R/O      1  Extended self-test log
0x09           SL  R/W      1  Selective self-test log
0x10       GPL     R/O      1  NCQ Command Error log
0x11       GPL     R/O      1  SATA Phy Event Counters log
0x80-0x9f  GPL,SL  R/W     16  Host vendor specific log
0xa0-0xa7  GPL,SL  VS      16  Device vendor specific log
0xa8-0xb7  GPL,SL  VS       1  Device vendor specific log
0xbd       GPL,SL  VS       1  Device vendor specific log
0xc0       GPL,SL  VS       1  Device vendor specific log
0xc1       GPL     VS      93  Device vendor specific log
0xe0       GPL,SL  R/W      1  SCT Command/Status
0xe1       GPL,SL  R/W      1  SCT Data Transfer

SMART Extended Comprehensive Error Log Version: 1 (6 sectors)
Device Error Count: 64 (device log contains only the most recent 24 errors)
    CR     = Command Register
    FEATR  = Features Register
    COUNT  = Count (was: Sector Count) Register
    LBA_48 = Upper bytes of LBA High/Mid/Low Registers ]  ATA-8
    LH     = LBA High (was: Cylinder High) Register    ]   LBA
    LM     = LBA Mid (was: Cylinder Low) Register      ] Register
    LL     = LBA Low (was: Sector Number) Register     ]
    DV     = Device (was: Device/Head) Register
    DC     = Device Control Register
    ER     = Error register
    ST     = Status register
Powered_Up_Time is measured from power on, and printed as
DDd+hh:mm:SS.sss where DD=days, hh=hours, mm=minutes,
SS=sec, and sss=millisec. It "wraps" after 49.710 days.

Error 64 [15] occurred at disk power-on lifetime: 37695 hours (1570 days + 15 hours)
  When the command that caused the error occurred, the device was active or idle.

  After command completion occurred, registers were:
  ER -- ST COUNT  LBA_48  LH LM LL DV DC
  -- -- -- == -- == == == -- -- -- -- --
  40 -- 51 00 00 00 00 d5 58 7a b8 40 00  Error: WP at LBA = 0xd5587ab8 = 3579345592

  Commands leading to the command that caused the error were:
  CR FEATR COUNT  LBA_48  LH LM LL DV DC  Powered_Up_Time  Command/Feature_Name
  -- == -- == -- == == == -- -- -- -- --  ---------------  --------------------
  61 00 10 00 00 00 00 d5 58 67 e8 40 00 44d+06:42:10.818  WRITE FPDMA QUEUED
  60 00 10 00 48 00 00 e8 e0 86 90 40 00 44d+06:42:10.818  READ FPDMA QUEUED
  60 00 10 00 40 00 00 e8 e0 84 90 40 00 44d+06:42:10.818  READ FPDMA QUEUED
  60 00 10 00 38 00 00 00 40 02 90 40 00 44d+06:42:10.818  READ FPDMA QUEUED
  60 00 40 00 30 00 00 d5 58 7a 90 40 00 44d+06:42:10.818  READ FPDMA QUEUED

Error 63 [14] occurred at disk power-on lifetime: 37695 hours (1570 days + 15 hours)
  When the command that caused the error occurred, the device was active or idle.

  After command completion occurred, registers were:
  ER -- ST COUNT  LBA_48  LH LM LL DV DC
  -- -- -- == -- == == == -- -- -- -- --
  40 -- 51 00 00 00 00 d5 58 76 90 40 00  Error: UNC at LBA = 0xd5587690 = 3579344528

  Commands leading to the command that caused the error were:
  CR FEATR COUNT  LBA_48  LH LM LL DV DC  Powered_Up_Time  Command/Feature_Name
  -- == -- == -- == == == -- -- -- -- --  ---------------  --------------------
  60 00 10 00 58 00 00 e8 e0 86 90 40 00 44d+06:42:07.901  READ FPDMA QUEUED
  60 00 10 00 50 00 00 e8 e0 84 90 40 00 44d+06:42:07.901  READ FPDMA QUEUED
  60 00 10 00 48 00 00 00 40 02 90 40 00 44d+06:42:07.901  READ FPDMA QUEUED
  60 00 40 00 40 00 00 d5 58 7a 90 40 00 44d+06:42:07.901  READ FPDMA QUEUED
  60 01 00 00 38 00 00 d5 58 79 90 40 00 44d+06:42:07.901  READ FPDMA QUEUED

Error 62 [13] occurred at disk power-on lifetime: 37695 hours (1570 days + 15 hours)
  When the command that caused the error occurred, the device was active or idle.

  After command completion occurred, registers were:
  ER -- ST COUNT  LBA_48  LH LM LL DV DC
  -- -- -- == -- == == == -- -- -- -- --
  40 -- 51 00 00 00 00 d5 58 74 a8 40 00  Error: WP at LBA = 0xd55874a8 = 3579344040

  Commands leading to the command that caused the error were:
  CR FEATR COUNT  LBA_48  LH LM LL DV DC  Powered_Up_Time  Command/Feature_Name
  -- == -- == -- == == == -- -- -- -- --  ---------------  --------------------
  61 00 c0 00 20 00 00 9b 54 9b c0 40 00 44d+06:42:04.083  WRITE FPDMA QUEUED
  61 00 40 00 68 00 00 9b 54 96 98 40 00 44d+06:42:04.083  WRITE FPDMA QUEUED
  61 00 80 00 60 00 00 9b 54 95 c8 40 00 44d+06:42:04.083  WRITE FPDMA QUEUED
  61 00 80 00 58 00 00 9b 54 91 88 40 00 44d+06:42:04.083  WRITE FPDMA QUEUED
  61 00 b0 00 50 00 00 d5 58 5e 60 40 00 44d+06:42:04.082  WRITE FPDMA QUEUED

Error 61 [12] occurred at disk power-on lifetime: 37695 hours (1570 days + 15 hours)
  When the command that caused the error occurred, the device was active or idle.

  After command completion occurred, registers were:
  ER -- ST COUNT  LBA_48  LH LM LL DV DC
  -- -- -- == -- == == == -- -- -- -- --
  40 -- 51 00 00 00 00 d5 58 72 10 40 00  Error: WP at LBA = 0xd5587210 = 3579343376

  Commands leading to the command that caused the error were:
  CR FEATR COUNT  LBA_48  LH LM LL DV DC  Powered_Up_Time  Command/Feature_Name
  -- == -- == -- == == == -- -- -- -- --  ---------------  --------------------
  61 00 b0 00 28 00 00 d5 58 5e 60 40 00 44d+06:42:01.263  WRITE FPDMA QUEUED
  61 01 00 00 00 00 00 d5 58 5d 60 40 00 44d+06:42:01.263  WRITE FPDMA QUEUED
  60 00 a0 00 20 00 00 d5 58 75 a0 40 00 44d+06:42:01.263  READ FPDMA QUEUED
  60 00 b0 00 18 00 00 d5 58 74 10 40 00 44d+06:42:01.262  READ FPDMA QUEUED
  60 01 00 00 10 00 00 d5 58 73 10 40 00 44d+06:42:01.262  READ FPDMA QUEUED

Error 60 [11] occurred at disk power-on lifetime: 37695 hours (1570 days + 15 hours)
  When the command that caused the error occurred, the device was active or idle.

  After command completion occurred, registers were:
  ER -- ST COUNT  LBA_48  LH LM LL DV DC
  -- -- -- == -- == == == -- -- -- -- --
  40 -- 51 00 00 00 00 d5 58 5b 38 40 00  Error: WP at LBA = 0xd5585b38 = 3579337528

  Commands leading to the command that caused the error were:
  CR FEATR COUNT  LBA_48  LH LM LL DV DC  Powered_Up_Time  Command/Feature_Name
  -- == -- == -- == == == -- -- -- -- --  ---------------  --------------------
  61 00 80 00 60 00 00 9b 54 83 d8 40 00 44d+06:41:55.128  WRITE FPDMA QUEUED
  61 00 40 00 58 00 00 9b 54 83 60 40 00 44d+06:41:55.127  WRITE FPDMA QUEUED
  61 01 00 00 18 00 00 9b 54 82 60 40 00 44d+06:41:55.127  WRITE FPDMA QUEUED
  61 01 00 00 50 00 00 9b 54 81 00 40 00 44d+06:41:55.127  WRITE FPDMA QUEUED
  60 00 18 00 10 00 00 d5 58 6a c0 40 00 44d+06:41:55.127  READ FPDMA QUEUED

Error 59 [10] occurred at disk power-on lifetime: 37695 hours (1570 days + 15 hours)
  When the command that caused the error occurred, the device was active or idle.

  After command completion occurred, registers were:
  ER -- ST COUNT  LBA_48  LH LM LL DV DC
  -- -- -- == -- == == == -- -- -- -- --
  40 -- 51 00 00 00 00 d5 58 67 c0 40 00  Error: UNC at LBA = 0xd55867c0 = 3579340736

  Commands leading to the command that caused the error were:
  CR FEATR COUNT  LBA_48  LH LM LL DV DC  Powered_Up_Time  Command/Feature_Name
  -- == -- == -- == == == -- -- -- -- --  ---------------  --------------------
  60 00 68 00 08 00 00 d5 58 67 c0 40 00 44d+06:41:52.309  READ FPDMA QUEUED
  61 00 10 00 20 00 00 e8 e0 86 90 40 00 44d+06:41:52.304  WRITE FPDMA QUEUED
  61 00 10 00 10 00 00 e8 e0 84 90 40 00 44d+06:41:52.303  WRITE FPDMA QUEUED
  60 00 40 00 08 00 00 d5 58 65 98 40 00 44d+06:41:52.303  READ FPDMA QUEUED
  60 00 10 00 28 00 00 e8 e0 86 90 40 00 44d+06:41:52.296  READ FPDMA QUEUED

Error 58 [9] occurred at disk power-on lifetime: 37695 hours (1570 days + 15 hours)
  When the command that caused the error occurred, the device was active or idle.

  After command completion occurred, registers were:
  ER -- ST COUNT  LBA_48  LH LM LL DV DC
  -- -- -- == -- == == == -- -- -- -- --
  40 -- 51 00 00 00 00 d5 58 5e e0 40 00  Error: WP at LBA = 0xd5585ee0 = 3579338464

  Commands leading to the command that caused the error were:
  CR FEATR COUNT  LBA_48  LH LM LL DV DC  Powered_Up_Time  Command/Feature_Name
  -- == -- == -- == == == -- -- -- -- --  ---------------  --------------------
  61 00 08 00 38 00 00 d5 58 56 50 40 00 44d+06:41:49.014  WRITE FPDMA QUEUED
  61 00 40 00 30 00 00 9b 54 7e 08 40 00 44d+06:41:49.013  WRITE FPDMA QUEUED
  61 01 00 00 28 00 00 9b 54 7d 08 40 00 44d+06:41:49.013  WRITE FPDMA QUEUED
  61 00 40 00 20 00 00 9b 54 7b a0 40 00 44d+06:41:49.013  WRITE FPDMA QUEUED
  60 01 00 00 18 00 00 d5 58 5f 40 40 00 44d+06:41:49.013  READ FPDMA QUEUED

Error 57 [8] occurred at disk power-on lifetime: 37695 hours (1570 days + 15 hours)
  When the command that caused the error occurred, the device was active or idle.

  After command completion occurred, registers were:
  ER -- ST COUNT  LBA_48  LH LM LL DV DC
  -- -- -- == -- == == == -- -- -- -- --
  40 -- 51 00 00 00 00 d5 58 5d 40 40 00  Error: WP at LBA = 0xd5585d40 = 3579338048

  Commands leading to the command that caused the error were:
  CR FEATR COUNT  LBA_48  LH LM LL DV DC  Powered_Up_Time  Command/Feature_Name
  -- == -- == -- == == == -- -- -- -- --  ---------------  --------------------
  61 00 40 00 78 00 00 9b 54 7e 08 40 00 44d+06:41:46.193  WRITE FPDMA QUEUED
  61 01 00 00 08 00 00 9b 54 7d 08 40 00 44d+06:41:46.193  WRITE FPDMA QUEUED
  61 00 40 00 70 00 00 9b 54 7b a0 40 00 44d+06:41:46.193  WRITE FPDMA QUEUED
  60 00 60 00 00 00 00 d5 58 60 40 40 00 44d+06:41:46.193  READ FPDMA QUEUED
  60 01 00 00 68 00 00 d5 58 5f 40 40 00 44d+06:41:46.193  READ FPDMA QUEUED

SMART Extended Self-test Log Version: 1 (1 sectors)
Num  Test_Description    Status                  Remaining  LifeTime(hours)  LBA_of_first_error
# 1  Extended offline    Completed without error       00%     37634         -
# 2  Extended offline    Completed without error       00%     37467         -
# 3  Short offline       Completed without error       00%     37408         -
# 4  Short offline       Completed without error       00%     37386         -
# 5  Short offline       Completed without error       00%     37360         -
# 6  Short offline       Completed without error       00%     37337         -
# 7  Short offline       Completed without error       00%     37312         -
# 8  Extended offline    Completed without error       00%     37304         -
# 9  Short offline       Completed without error       00%     37289         -
#10  Short offline       Completed without error       00%     37265         -
#11  Short offline       Completed without error       00%     37241         -
#12  Short offline       Completed without error       00%     37217         -
#13  Short offline       Completed without error       00%     37193         -
#14  Short offline       Completed without error       00%     37169         -
#15  Short offline       Completed without error       00%     37145         -
#16  Extended offline    Completed without error       00%     37130         -
#17  Short offline       Completed without error       00%     37121         -
#18  Short offline       Completed without error       00%     37097         -

SMART Selective self-test log data structure revision number 1
 SPAN  MIN_LBA  MAX_LBA  CURRENT_TEST_STATUS
    1        0        0  Not_testing
    2        0        0  Not_testing
    3        0        0  Not_testing
    4        0        0  Not_testing
    5        0        0  Not_testing
Selective self-test flags (0x0):
  After scanning selected spans, do NOT read-scan remainder of disk.
If Selective self-test is pending on power-up, resume after 0 minute delay.

SCT Status Version:                  3
SCT Version (vendor specific):       258 (0x0102)
SCT Support Level:                   1
Device State:                        Active (0)
Current Temperature:                    26 Celsius
Power Cycle Min/Max Temperature:     14/30 Celsius
Lifetime    Min/Max Temperature:     14/43 Celsius
Under/Over Temperature Limit Count:   0/0

SCT Temperature History Version:     2
Temperature Sampling Period:         1 minute
Temperature Logging Interval:        1 minute
Min/Max recommended Temperature:      0/60 Celsius
Min/Max Temperature Limit:           -41/85 Celsius
Temperature History Size (Index):    478 (8)

Index    Estimated Time   Temperature Celsius
   9    2018-12-18 08:52    23  ****
 ...    ..( 13 skipped).    ..  ****
  23    2018-12-18 09:06    23  ****
  24    2018-12-18 09:07    24  *****
 ...    ..( 54 skipped).    ..  *****
  79    2018-12-18 10:02    24  *****
  80    2018-12-18 10:03    25  ******
 ...    ..(105 skipped).    ..  ******
 186    2018-12-18 11:49    25  ******
 187    2018-12-18 11:50    26  *******
 ...    ..( 30 skipped).    ..  *******
 218    2018-12-18 12:21    26  *******
 219    2018-12-18 12:22    25  ******
 220    2018-12-18 12:23    25  ******
 221    2018-12-18 12:24    26  *******
 ...    ..(  9 skipped).    ..  *******
 231    2018-12-18 12:34    26  *******
 232    2018-12-18 12:35    25  ******
 233    2018-12-18 12:36    26  *******
 234    2018-12-18 12:37    26  *******
 235    2018-12-18 12:38    26  *******
 236    2018-12-18 12:39    25  ******
 ...    ..(  2 skipped).    ..  ******
 239    2018-12-18 12:42    25  ******
 240    2018-12-18 12:43    26  *******
 241    2018-12-18 12:44    25  ******
 242    2018-12-18 12:45    26  *******
 ...    ..(  2 skipped).    ..  *******
 245    2018-12-18 12:48    26  *******
 246    2018-12-18 12:49    25  ******
 ...    ..( 21 skipped).    ..  ******
 268    2018-12-18 13:11    25  ******
 269    2018-12-18 13:12    26  *******
 ...    ..(  4 skipped).    ..  *******
 274    2018-12-18 13:17    26  *******
 275    2018-12-18 13:18    22  ***
 ...    ..(123 skipped).    ..  ***
 399    2018-12-18 15:22    22  ***
 400    2018-12-18 15:23    23  ****
 401    2018-12-18 15:24    22  ***
 402    2018-12-18 15:25    23  ****
 ...    ..( 83 skipped).    ..  ****
   8    2018-12-18 16:49    23  ****

SCT Error Recovery Control command not supported

Device Statistics (GP/SMART Log 0x04) not supported

Pending Defects log (GP Log 0x0c) not supported

SATA Phy Event Counters (GP Log 0x11)
ID      Size     Value  Description
0x0001  2            0  Command failed due to ICRC error
0x0002  2            0  R_ERR response for data FIS
0x0003  2            0  R_ERR response for device-to-host data FIS
0x0004  2            0  R_ERR response for host-to-device data FIS
0x0005  2            0  R_ERR response for non-data FIS
0x0006  2            0  R_ERR response for device-to-host non-data FIS
0x0007  2            0  R_ERR response for host-to-device non-data FIS
0x0008  2            0  Device-to-host non-data FIS retries
0x0009  2            2  Transition from drive PhyRdy to drive PhyNRdy
0x000a  2            3  Device-to-host register FISes sent due to a COMRESET
0x000b  2            0  CRC errors within host-to-device FIS
0x000f  2            0  R_ERR response for host-to-device data FIS, CRC
0x0012  2            0  R_ERR response for host-to-device non-data FIS, CRC
0x8000  4      3888454  Vendor specific

root@freenas2:~ # 


I realized that I have a suitable replacement disk on hand, so I've already started the replacement.
 

droeders

Contributor
Joined
Mar 21, 2016
Messages
179
This is definitely strange. Did FreeNAS run a 'zpool clear', but kept track of an old error count? I'm sure that 'zpool history' would show a clear operation.
 

danb35

Hall of Famer
Joined
Aug 16, 2011
Messages
15,504
OK, the replacement is in and resilvered into the pool (and while that was going on, da0 went from 1, to 4, to 215 offline-uncorrectable sectors--definitely dying). Discrepancy is still there:
Code:
root@freenas2:~ # zpool status tank
  pool: tank
 state: ONLINE
  scan: resilvered 18.9M in 0 days 00:00:09 with 0 errors on Wed Dec 19 17:01:21 2018
config:

    NAME                                            STATE     READ WRITE CKSUM
    tank                                            ONLINE       0     0     0
      raidz2-0                                      ONLINE       0     0     0
        gptid/9a85d15f-8d5c-11e4-8732-0cc47a01304d  ONLINE       0     0     0
        gptid/9afa89ae-8d5c-11e4-8732-0cc47a01304d  ONLINE       0     0     0
        gptid/9b6cc00b-8d5c-11e4-8732-0cc47a01304d  ONLINE       0     0     0
        gptid/9c501d57-8d5c-11e4-8732-0cc47a01304d  ONLINE       0     0     0
        gptid/9cc41939-8d5c-11e4-8732-0cc47a01304d  ONLINE       0     0     0
        gptid/9d39e31d-8d5c-11e4-8732-0cc47a01304d  ONLINE       0     0     0
      raidz2-1                                      ONLINE       0     0     0
        gptid/f5b737a6-8e41-11e4-8732-0cc47a01304d  ONLINE       0     0     0
        gptid/7e2d9269-8a4e-11e5-bec2-002590de8695  ONLINE       0     0     0
        gptid/f68f4fa9-8e41-11e4-8732-0cc47a01304d  ONLINE       0     0     0
        gptid/f722e509-8e41-11e4-8732-0cc47a01304d  ONLINE       0     0     0
        gptid/56c2074c-657f-11e6-877d-002590caf340  ONLINE       0     0     0
        gptid/755b90e1-030b-11e9-9d85-002590caf340  ONLINE       0     0     0
      raidz2-2                                      ONLINE       0     0     0
        gptid/2c854638-212c-11e6-881c-002590caf340  ONLINE       0     0     0
        gptid/2dc4f155-212c-11e6-881c-002590caf340  ONLINE       0     0     0
        gptid/b7625ade-6980-11e6-877d-002590caf340  ONLINE       0     0     0
        gptid/1abefcac-acb9-11e6-8df3-002590caf340  ONLINE       0     0     0
        gptid/3d317e50-67dd-11e6-877d-002590caf340  ONLINE       0     0     0
        gptid/192328aa-fc8e-11e6-aef3-002590caf340  ONLINE       0     0     0

errors: No known data errors


1545258834641.png


Bug #65205 submitted, though it should be private due to the attached debug file.
 

Chris Moore

Hall of Famer
Joined
May 2, 2015
Messages
10,080

danb35

Hall of Famer
Joined
Aug 16, 2011
Messages
15,504
At least the number changed...
True. There were checksum errors reported while the replacement was underway:
Code:
  pool: tank
 state: ONLINE
status: One or more devices is currently being resilvered.  The pool will
    continue to function, possibly in a degraded state.
action: Wait for the resilver to complete.
  scan: resilver in progress since Tue Dec 18 16:25:37 2018
    42.5T scanned at 2.38G/s, 38.4T issued at 2.15G/s, 43.5T total
    821G resilvered, 88.27% done, 0 days 00:40:26 to go
config:

    NAME                                              STATE     READ WRITE CKSUM
    tank                                              ONLINE       0     0     0
      raidz2-0                                        ONLINE       0     0     0
        gptid/9a85d15f-8d5c-11e4-8732-0cc47a01304d    ONLINE       0     0     0
        gptid/9afa89ae-8d5c-11e4-8732-0cc47a01304d    ONLINE       0     0     0
        gptid/9b6cc00b-8d5c-11e4-8732-0cc47a01304d    ONLINE       0     0     0
        gptid/9c501d57-8d5c-11e4-8732-0cc47a01304d    ONLINE       0     0     0
        gptid/9cc41939-8d5c-11e4-8732-0cc47a01304d    ONLINE       0     0     0
        gptid/9d39e31d-8d5c-11e4-8732-0cc47a01304d    ONLINE       0     0     0
      raidz2-1                                        ONLINE       0     0     0
        gptid/f5b737a6-8e41-11e4-8732-0cc47a01304d    ONLINE       0     0     0
        gptid/7e2d9269-8a4e-11e5-bec2-002590de8695    ONLINE       0     0     0
        gptid/f68f4fa9-8e41-11e4-8732-0cc47a01304d    ONLINE       0     0     0
        gptid/f722e509-8e41-11e4-8732-0cc47a01304d    ONLINE       0     0     0
        gptid/56c2074c-657f-11e6-877d-002590caf340    ONLINE       0     0     0
        replacing-5                                   ONLINE       0     0    30
          gptid/82d5cbf5-2a41-11e6-a151-002590caf340  ONLINE       0     0     0
          gptid/755b90e1-030b-11e9-9d85-002590caf340  ONLINE       0     0     0
      raidz2-2                                        ONLINE       0     0     0
        gptid/2c854638-212c-11e6-881c-002590caf340    ONLINE       0     0     0
        gptid/2dc4f155-212c-11e6-881c-002590caf340    ONLINE       0     0     0
        gptid/b7625ade-6980-11e6-877d-002590caf340    ONLINE       0     0     0
        gptid/1abefcac-acb9-11e6-8df3-002590caf340    ONLINE       0     0     0
        gptid/3d317e50-67dd-11e6-877d-002590caf340    ONLINE       0     0     0
        gptid/192328aa-fc8e-11e6-aef3-002590caf340    ONLINE       0     0     0

errors: No known data errors

...but none since. Strange. I'll see what I hear back on the bug report.
 

joeschmuck

Old Man
Moderator
Joined
May 28, 2011
Messages
10,994
Very odd behavior. Glad you submitted a bug report and curious if this was a feature gone wrong.
 
Status
Not open for further replies.
Top