Scrub/resilver prefetch and l2arc performance problems

Borja Marcos

Contributor
Joined
Nov 24, 2014
Messages
125
Hi,

I posted this to freebsd-fs but I imagine it's of interest here as well.

On one of my systems I noticed a severe performance hit for scrubs since the sequential scrub/resilver was introduced. Digging into the issue I found out that the system was stressing the l2arc severely during the scrub. The symptom was, a scrub kept running for several days with negligible progress. There were no hardware problems, none of the disks was misbehaving (I graph the response times and they were uniform).

I am not 100% sure it's related to the new scrub code because I have just started a scrub using the legacy scrub mode and it seems to be happening as well.

Did I somewhat hit a worst case or should vfs.zfs.no_scrub_prefetch default to 1 (disabled)? For now I am setting it to 1 on my systems.

The server is running FreeBSD 12 but this happened with FreeBSD 11 as well (hence I think it's pertinent to FreeNAS). I just hadn't investigated it before I updated to 12.

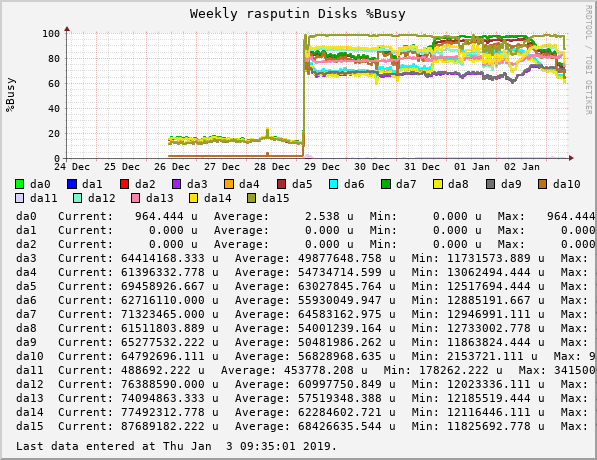
Exhibit one: disk bandwidth.
devilator_rasputin_gauge_volatile_diskbw_((ada|da|ad|mfid|aacd|amrd|nvd)|d+)_busypct-weekly.png


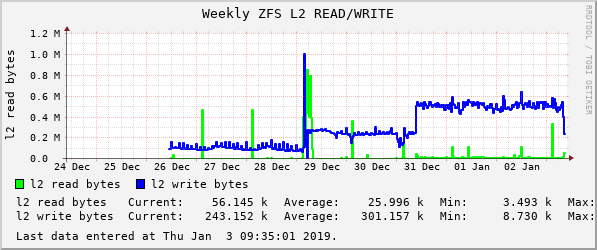
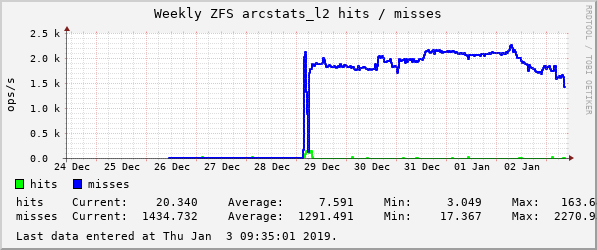
Despite the long time, on Jan 3rd it had completed less than 20% of the scrub. Looking at other ZFS stats I noticed stress on the l2arc. There were increased writes and l2arc misses.
devilator_rasputin_counter_zfs_arcstats_l2_read_bytes,__zfs_arcstats_l2_write_bytes-weekly.png


devilator_rasputin_counter_zfs_arcstats_l2_hits,__zfs_arcstats_l2_misses-weekly.png


Suspecting something fishy with the scrub prefetches I tried disabling scrub prefetch. And the effect couldn't be more dramatic. Setting the vfs.zfs.no_scrub_prefetch to 1 the scrub begun progressing healthily. The busy percent of the disks went down and performance improved as well.
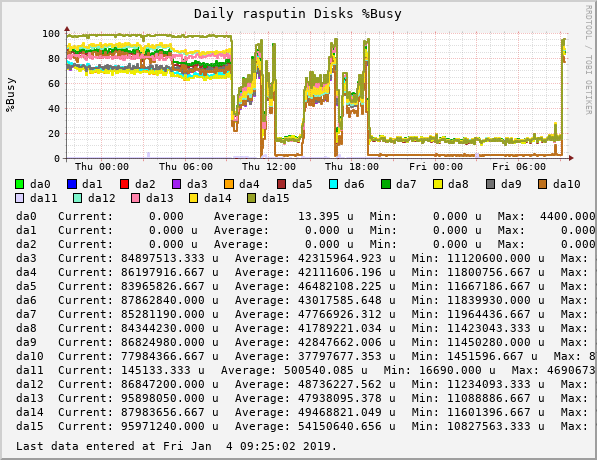
devilator_rasputin_gauge_volatile_diskbw_((ada|da|ad|mfid|aacd|amrd|nvd)|d+)_busypct-daily.png


The busy% went from almost 100 to 40% when I disable the scrub prefetch. At the same time the scrub begun progressing normally and it actually finished in about three hours. The two peaks after around 13:30 are another scrub I started with scrub prefetch disabled. As you can see it worked normally.

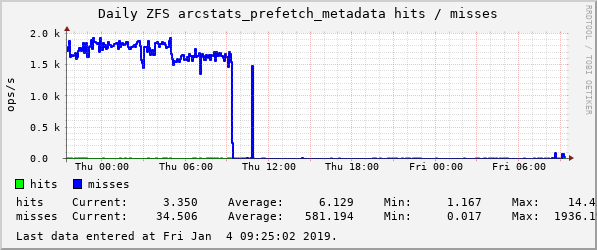
Other stats show that the l2arc was really relieved when I disabled scrub prefetch.
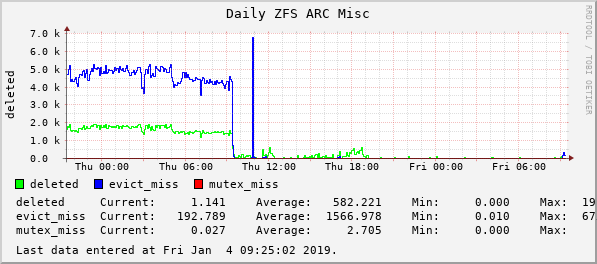
devilator_rasputin_counter_zfs_arcstats_deleted,__zfs_arcstats_evict_skip,__zfs_arcstats_mutex...png


devilator_rasputin_counter_zfs_arcstats_prefetch_metadata_hits,__zfs_arcstats_prefetch_metadat...png


And the prefetch also hurt the vdev cache. It behaved much better during the second scrub with prefetch disabled.
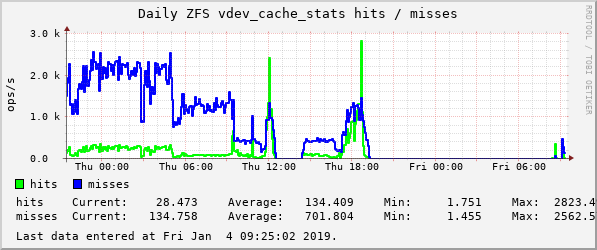
devilator_rasputin_counter_zfs_vdev_cache_stats_hits,__zfs_vdev_cache_stats_misses-daily.png


I have started another scrub today with scrub prefetch enabled but using the legacy scrub code and it has stalled again. Looking at the cache stats I see
that it's suffering as well. I include just a couple of graphs.
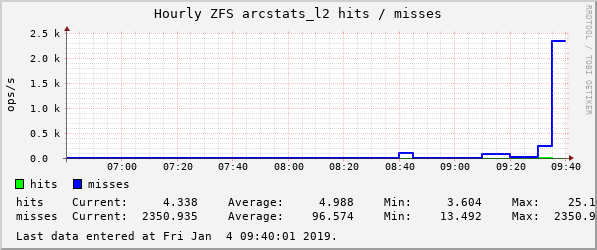
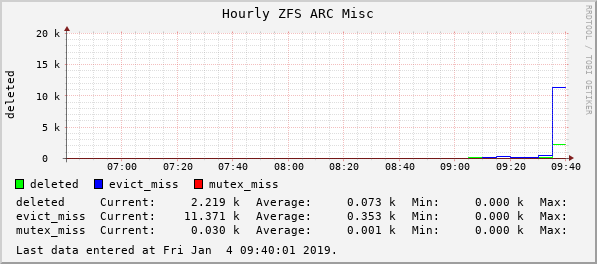
devilator_rasputin_counter_zfs_arcstats_l2_hits,__zfs_arcstats_l2_misses-hourly.png

devilator_rasputin_counter_zfs_arcstats_deleted,__zfs_arcstats_evict_skip,__zfs_arcstats_mutex...png


Now, the system configuration. It's a Sun X4240 (yep, old kit!). I replaced the RAID card with a LSI2008. It's running the IR firmware (I didn´t bother to cross flash it) but of course I am using it just as a plain HBA.

The pool was created in 2012. I know, raidz2 would have been better! And yes, both l2arc and zil are not the best choice on a single SSD, but given that the latency is so low it still helps a lot.

# zpool status

pool: pool

state: ONLINE

scan: scrub in progress since Fri Jan 4 09:10:06 2019

46.5G scanned at 15.5M/s, 46.5G issued at 15.5M/s, 537G total

0 repaired, 8.66% done, 0 days 09:01:09 to go

config:


NAME STATE READ WRITE CKSUM

pool ONLINE 0 0 0

raidz1-0 ONLINE 0 0 0

da12 ONLINE 0 0 0

da13 ONLINE 0 0 0

da14 ONLINE 0 0 0

da9 ONLINE 0 0 0

da15 ONLINE 0 0 0

da3 ONLINE 0 0 0

raidz1-1 ONLINE 0 0 0

da10 ONLINE 0 0 0

da4 ONLINE 0 0 0

da5 ONLINE 0 0 0

da6 ONLINE 0 0 0

da7 ONLINE 0 0 0

da8 ONLINE 0 0 0

logs

da11p2 ONLINE 0 0 0

cache

da11p3 ONLINE 0 0 0


errors: No known data errors
 

Borja Marcos

Contributor
Joined
Nov 24, 2014
Messages
125
One quick note. I found this talk about a new prefetcher for the scrubs.

https://www.youtube.com/watch?v=upn9tYh917s

I wonder, when was this added? Is the new prefetcher used if I select the "legacy" scrub?

I am sure I suffered this kind of problem some time ago on FreeBSD 11 but I had a couple of disk failures at the time and I
thought that the painfully slow scrubs were due to the disk failures.
 

Chris Moore

Hall of Famer
Joined
May 2, 2015
Messages
10,080
The server is running FreeBSD 12 but this happened with FreeBSD 11 as well (hence I think it's pertinent to FreeNAS). I just hadn't investigated it before I updated to 12.
Would you tell us a bit more about the hardware and software configuration of your system so we can try to make some correlation to what we might be seeing in FreeNAS?
 

Borja Marcos

Contributor
Joined
Nov 24, 2014
Messages
125
Would you tell us a bit more about the hardware and software configuration of your system so we can try to make some correlation to what we might be seeing in FreeNAS?

Of course. I can also tell you that a friend has reproduced something similar on a Microserver Gen8 with 16 GB of memory, four 3 TB WD Reds in RAIDZ and a SSD for ZIL+L2ARC. With the scrub prefectch activated a scrub took 18 hours. With scrub prefetch deactivated it took 3 hours 21 minutes. My friend's server is running FreeNAS. And he didn't suffer this issue with the previous versions.

I have a server running FreeNAS with the same configuration, I will try to reproduce it as well.

My configuration. Let me know what else you need of course. I am pretty sure I begun suffering this issue with FreeBSD 11. Unfortunately it was masked by a perfect storm: Two disk failures and a bad case of fat fingers in which I "zfs replaced" the wrong disk. It took like a week to resilver but I thought it was because of the ailing disks.

root@rasputin:~ # uname -a

FreeBSD 12.0-RELEASE-p1 FreeBSD 12.0-RELEASE-p1 RASPUTIN12 amd64


# camcontrol devlist

<SEAGATE ST914603SSUN146G 0868> at scbus6 target 11 lun 0 (pass0,da0)
<SEAGATE ST914603SSUN146G 0868> at scbus6 target 15 lun 0 (pass1,da1)
<SEAGATE ST9146803SS FS03> at scbus6 target 17 lun 0 (pass2,da2)
<SEAGATE ST914603SSUN146G 0868> at scbus6 target 18 lun 0 (pass3,da3)
<SEAGATE ST9146803SS FS03> at scbus6 target 20 lun 0 (pass4,da4)
<SEAGATE ST914603SSUN146G 0868> at scbus6 target 21 lun 0 (pass5,da5)
<SEAGATE ST9146803SS FS03> at scbus6 target 22 lun 0 (pass6,da6)
<SEAGATE ST914603SSUN146G 0868> at scbus6 target 23 lun 0 (pass7,da7)
<SEAGATE ST914603SSUN146G 0868> at scbus6 target 24 lun 0 (pass8,da8)
<SEAGATE ST9146803SS FS03> at scbus6 target 25 lun 0 (pass9,da9)
<SEAGATE ST9146803SS FS03> at scbus6 target 26 lun 0 (pass10,da10)
<LSILOGIC SASX28 A.0 5021> at scbus6 target 27 lun 0 (ses0,pass11)
<ATA Samsung SSD 850 2B6Q> at scbus6 target 28 lun 0 (pass12,da11)
<SEAGATE ST9146803SS FS03> at scbus6 target 29 lun 0 (pass13,da12)
<SEAGATE ST9146802SS S229> at scbus6 target 30 lun 0 (pass14,da13)
<SEAGATE ST9146803SS FS03> at scbus6 target 32 lun 0 (pass15,da14)
<SEAGATE ST9146802SS S22B> at scbus6 target 33 lun 0 (pass16,da15)
<TSSTcorp CD/DVDW TS-T632A SR03> at scbus13 target 0 lun 0 (pass17,cd0)

CPU: Six-Core AMD Opteron(tm) Processor 2431 (2400.14-MHz K8-class CPU)
Origin="AuthenticAMD" Id=0x100f80 Family=0x10 Model=0x8 Stepping=0

CPU, etc:
Features=0x178bfbff<FPU,VME,DE,PSE,TSC,MSR,PAE,MCE,CX8,APIC,SEP,MTRR,PGE,MCA,CMOV,PAT,PSE36,CLFLUSH,MMX,FXSR,SSE,SSE2,HTT>
Features2=0x802009<SSE3,MON,CX16,POPCNT>
AMD Features=0xee500800<SYSCALL,NX,MMX+,FFXSR,Page1GB,RDTSCP,LM,3DNow!+,3DNow!>
AMD Features2=0x37ff<LAHF,CMP,SVM,ExtAPIC,CR8,ABM,SSE4A,MAS,Prefetch,OSVW,IBS,SKINIT,WDT>
SVM: NP,NRIP,NAsids=64
TSC: P-state invariant
real memory = 8589934592 (8192 MB)
avail memory = 8294350848 (7910 MB)


HBA (not the stock one supplied by Sun, originally it was an aacraid device)
mps0: <Avago Technologies (LSI) SAS2008> port 0x9000-0x90ff mem 0xdfff0000-0xdfffffff,0xdff80000-0xdffbffff irq 17 at device 0.0 numa-domain 0 on pci4
mps0: Firmware: 20.00.07.00, Driver: 21.02.00.00-fbsd
mps0: IOCCapabilities: 185c<ScsiTaskFull,DiagTrace,SnapBuf,EEDP,TransRetry,IR>


The drives are SAS except for the SATA SSD, connected to a SAS backplane.

ses0 at mps0 bus 0 scbus6 target 27 lun 0
ses0: <LSILOGIC SASX28 A.0 5021> Fixed Enclosure Services SPC-3 SCSI device
ses0: 300.000MB/s transfers
ses0: Command Queueing enabled
ses0: SCSI-3 ENC Device

I have some "ZFS crap" (ie, values left from past experiments) on /boot/loader.conf and /etc/sysctl.conf, but my friend has reproduced this problem on his FreeNAS system without any of these.

# fgrep zfs /boot/loader.conf
zfs_load="YES"
vfs.root.mountfrom="zfs:pool/root"
vfs.zfs.arc_max="4G"
vfs.zfs.trim.enabled=1
vfs.zfs.vdev.cache.size="16M"
vfs.zfs.vdev.cache.max=16384
vfs.zfs.abd_chunk_size=1024


# fgrep zfs /etc/sysctl.conf
vfs.zfs.l2arc_norw=0
vfs.zfs.l2arc_write_boost=32000000
vfs.zfs.l2arc_write_max=32000000
vfs.zfs.l2arc_noprefetch=0
# vfs.zfs.free_max_blocks=131072
vfs.zfs.top_maxinflight=128
vfs.zfs.no_scrub_prefetch=1

I have tried to play with l2arc_noprefetch but it didn't make any effect on this particular issue. The key was to disable the scrub_prefetch.
 

Ericloewe

Server Wrangler
Moderator
Joined
Feb 15, 2014
Messages
20,175
I have just started a scrub using the legacy scrub mode
That's an option? I thought the new code was all-or-nothing. Could be a common code path bug, still.

One quick note. I found this talk about a new prefetcher for the scrubs.

https://www.youtube.com/watch?v=upn9tYh917s

I wonder, when was this added? Is the new prefetcher used if I select the "legacy" scrub?
I vaguely recall it being integrated early-to-mid last year, but not necessarily in FreeBSD. I'll ask around and report back if I get an answer. Fake edit:

Do you have a link to the mailing list thread? That'd be interesting to follow along. The FreeNAS ZFS people overlap a lot with the general FreeBSD ZFS people, so I'm sure the devs are already somewhat aware of this. You can always file a bug report and refer back to the mailing list.
 

Borja Marcos

Contributor
Joined
Nov 24, 2014
Messages
125
That's an option? I thought the new code was all-or-nothing. Could be a common code path bug, still.
Using the old scrub (if sysctl vfs.zfs.zfs_scan_legacy does what it's supposed to do) I saw a similar effect. Disabling scrub prefetch solved it.

I vaguely recall it being integrated early-to-mid last year, but not necessarily in FreeBSD. I'll ask around and report back if I get an answer. Fake edit:

Do you have a link to the mailing list thread? That'd be interesting to follow along. The FreeNAS ZFS people overlap a lot with the general FreeBSD ZFS people, so I'm sure the devs are already somewhat aware of this. You can always file a bug report and refer back to the mailing list.

Sure, although for now I only have a vague answer from Warner Losh blaming the unpredictability of SSDs. I have taken the SSD out of the equation by removing the l2arc and zil and starting a scrub with the scrub prefetch enabled.

The link: freebsd-fs link

Seems to be stuck again, this time there's no SSD.

Code:
# zpool status
  pool: pool
 state: ONLINE
  scan: scrub in progress since Fri Jan  4 21:27:53 2019
    26.5G scanned at 14.9M/s, 120M issued at 67.4K/s, 539G total
    0 repaired, 0.02% done, no estimated completion time


Half an hour since it begun and it's stuck at 26.5 GB while the disk busy percent is around 100%.

devilator_rasputin_gauge_volatile_diskbw_((ada|da|ad|mfid|aacd|amrd|nvd)|d+)_busypct-hourly.png
 

Ericloewe

Server Wrangler
Moderator
Joined
Feb 15, 2014
Messages
20,175
That said, your configuration is unusual, to say the least.
vfs.zfs.abd_chunk_size=1024
Why do you have this set to 1K? This should probably be 4K to match memory page size.

real memory = 8589934592 (8192 MB)
avail memory = 8294350848 (7910 MB)
That's pretty low. Damned low if you're running L2ARC - speaking of which, how large is it? L2ARC consumes L1ARC to store its pointers, so it is not a "might as well" kind of thing. L2ARC can easily destroy performance if your ARC is under-sized.
 

Ericloewe

Server Wrangler
Moderator
Joined
Feb 15, 2014
Messages
20,175
Can we get the header from top and the output of zfs-stats -a?
 

Borja Marcos

Contributor
Joined
Nov 24, 2014
Messages
125
That said, your configuration is unusual, to say the least.
Good question. As I said, there are scraps from likely wrong experiments I've made in the past, this is an old pool.

Anyway it works pretty well given the load it must handle, except for the scrubs becoming troublesome since some FreeBSD 11 release.

Why do you have this set to 1K? This should probably be 4K to match memory page size.
Honestly, I don´t know.

That's pretty low. Damned low if you're running L2ARC - speaking of which, how large is it? L2ARC consumes L1ARC to store its pointers, so it is not a "might as well" kind of thing. L2ARC can easily destroy performance if your ARC is under-sized.
Aha. Anyway I have removed L2ARC and ZIL it now to see if there's any difference.
 

Borja Marcos

Contributor
Joined
Nov 24, 2014
Messages
125
Can we get the header from top and the output of zfs-stats -a?

Sure. Remember that L2ARC is out of the equation now, although I am seeing a similar behavior. I have started a scrub with the scrub prefetch enabled.

Code:
last pid: 92609;  load averages:  1.42,  1.01,  0.93   up 14+14:46:59  22:06:49
50 processes:  2 running, 48 sleeping
CPU:  1.7% user,  0.0% nice,  3.4% system,  0.1% interrupt, 94.7% idle
Mem: 116M Active, 397M Inact, 155M Laundry, 6144M Wired, 18M Buf, 1131M Free
ARC: 3420M Total, 2293M MFU, 612M MRU, 116M Anon, 105M Header, 291M Other
     2442M Compressed, 24G Uncompressed, 9.89:1 Ratio
Swap: 32G Total, 179M Used, 32G Free


Code:
# zfs-stats -a

------------------------------------------------------------------------
ZFS Subsystem Report                Fri Jan  4 22:08:30 2019
------------------------------------------------------------------------

System Information:

    Kernel Version:                1200086 (osreldate)
    Hardware Platform:            amd64
    Processor Architecture:            amd64

    ZFS Storage pool Version:        5000
    ZFS Filesystem Version:            5

FreeBSD 12.0-RELEASE-p1 RASPUTIN12
10:08PM  up 14 days, 14:49, 1 user, load averages: 0.80, 0.98, 0.93

------------------------------------------------------------------------

System Memory:

    0.76%    60.05    MiB Active,    5.03%    399.71    MiB Inact
    79.49%    6.17    GiB Wired,    0.00%    0 Cache
    12.79%    1015.48    MiB Free,    1.94%    153.71    MiB Gap

    Real Installed:                8.00    GiB
    Real Available:            99.65%    7.97    GiB
    Real Managed:            97.30%    7.76    GiB

    Logical Total:                8.00    GiB
    Logical Used:            82.72%    6.62    GiB
    Logical Free:            17.28%    1.38    GiB

Kernel Memory:                    557.61    MiB
    Data:                95.34%    531.64    MiB
    Text:                4.66%    25.97    MiB

Kernel Memory Map:                7.76    GiB
    Size:                78.13%    6.06    GiB
    Free:                21.87%    1.70    GiB

------------------------------------------------------------------------

ARC Summary: (HEALTHY)
    Memory Throttle Count:            0

ARC Misc:
    Deleted:                740.75m
    Recycle Misses:                0
    Mutex Misses:                99.53m
    Evict Skips:                17.48b

ARC Size:                86.33%    3.45    GiB
    Target Size: (Adaptive)        100.00%    4.00    GiB
    Min Size (Hard Limit):        12.50%    512.00    MiB
    Max Size (High Water):        8:1    4.00    GiB

ARC Size Breakdown:
    Recently Used Cache Size:    69.63%    2.79    GiB
    Frequently Used Cache Size:    30.37%    1.21    GiB

ARC Hash Breakdown:
    Elements Max:                2.75m
    Elements Current:        17.56%    483.56k
    Collisions:                720.71m
    Chain Max:                14
    Chains:                    82.49k

------------------------------------------------------------------------

ARC Efficiency:                    24.53b
    Cache Hit Ratio:        96.25%    23.61b
    Cache Miss Ratio:        3.75%    919.95m
    Actual Hit Ratio:        96.23%    23.60b

    Data Demand Efficiency:        99.97%    20.27b
    Data Prefetch Efficiency:    97.09%    4.40m

    CACHE HITS BY CACHE LIST:
      Most Recently Used:        4.08%    962.86m
      Most Frequently Used:        95.90%    22.64b
      Most Recently Used Ghost:    0.02%    4.80m
      Most Frequently Used Ghost:    0.65%    153.78m

    CACHE HITS BY DATA TYPE:
      Demand Data:            85.84%    20.27b
      Prefetch Data:        0.02%    4.27m
      Demand Metadata:        14.12%    3.33b
      Prefetch Metadata:        0.01%    3.35m

    CACHE MISSES BY DATA TYPE:
      Demand Data:            0.57%    5.24m
      Prefetch Data:        0.01%    128.04k
      Demand Metadata:        3.33%    30.64m
      Prefetch Metadata:        96.09%    883.95m

------------------------------------------------------------------------

L2ARC is disabled

------------------------------------------------------------------------

File-Level Prefetch: (HEALTHY)

DMU Efficiency:                    15.83b
    Hit Ratio:            0.04%    5.90m
    Miss Ratio:            99.96%    15.83b

    Colinear:                0
      Hit Ratio:            100.00%    0
      Miss Ratio:            100.00%    0

    Stride:                    0
      Hit Ratio:            100.00%    0
      Miss Ratio:            100.00%    0

DMU Misc:
    Reclaim:                0
      Successes:            100.00%    0
      Failures:            100.00%    0

    Streams:                0
      +Resets:            100.00%    0
      -Resets:            100.00%    0
      Bogus:                0

------------------------------------------------------------------------

VDEV Cache Summary:                1.78b
    Hit Ratio:            7.03%    125.01m
    Miss Ratio:            52.26%    928.82m
    Delegations:            40.70%    723.35m

------------------------------------------------------------------------

ZFS Tunables (sysctl):
    kern.maxusers                           64
    vm.kmem_size                            8328187904
    vm.kmem_size_scale                      1
    vm.kmem_size_min                        0
    vm.kmem_size_max                        1319413950874
    vfs.zfs.trim.max_interval               1
    vfs.zfs.trim.timeout                    30
    vfs.zfs.trim.txg_delay                  32
    vfs.zfs.trim.enabled                    1
    vfs.zfs.vol.immediate_write_sz          32768
    vfs.zfs.vol.unmap_sync_enabled          0
    vfs.zfs.vol.unmap_enabled               1
    vfs.zfs.vol.recursive                   0
    vfs.zfs.vol.mode                        1
    vfs.zfs.version.zpl                     5
    vfs.zfs.version.spa                     5000
    vfs.zfs.version.acl                     1
    vfs.zfs.version.ioctl                   7
    vfs.zfs.debug                           0
    vfs.zfs.super_owner                     0
    vfs.zfs.immediate_write_sz              32768
    vfs.zfs.sync_pass_rewrite               2
    vfs.zfs.sync_pass_dont_compress         5
    vfs.zfs.sync_pass_deferred_free         2
    vfs.zfs.zio.dva_throttle_enabled        1
    vfs.zfs.zio.exclude_metadata            0
    vfs.zfs.zio.use_uma                     1
    vfs.zfs.zil_slog_bulk                   786432
    vfs.zfs.cache_flush_disable             0
    vfs.zfs.zil_replay_disable              0
    vfs.zfs.standard_sm_blksz               131072
    vfs.zfs.dtl_sm_blksz                    4096
    vfs.zfs.min_auto_ashift                 9
    vfs.zfs.max_auto_ashift                 13
    vfs.zfs.vdev.trim_max_pending           10000
    vfs.zfs.vdev.bio_delete_disable         0
    vfs.zfs.vdev.bio_flush_disable          0
    vfs.zfs.vdev.def_queue_depth            32
    vfs.zfs.vdev.queue_depth_pct            1000
    vfs.zfs.vdev.write_gap_limit            4096
    vfs.zfs.vdev.read_gap_limit             32768
    vfs.zfs.vdev.aggregation_limit          1048576
    vfs.zfs.vdev.initializing_max_active    1
    vfs.zfs.vdev.initializing_min_active    1
    vfs.zfs.vdev.removal_max_active         2
    vfs.zfs.vdev.removal_min_active         1
    vfs.zfs.vdev.trim_max_active            64
    vfs.zfs.vdev.trim_min_active            1
    vfs.zfs.vdev.scrub_max_active           2
    vfs.zfs.vdev.scrub_min_active           1
    vfs.zfs.vdev.async_write_max_active     10
    vfs.zfs.vdev.async_write_min_active     1
    vfs.zfs.vdev.async_read_max_active      3
    vfs.zfs.vdev.async_read_min_active      1
    vfs.zfs.vdev.sync_write_max_active      10
    vfs.zfs.vdev.sync_write_min_active      10
    vfs.zfs.vdev.sync_read_max_active       10
    vfs.zfs.vdev.sync_read_min_active       10
    vfs.zfs.vdev.max_active                 1000
    vfs.zfs.vdev.async_write_active_max_dirty_percent60
    vfs.zfs.vdev.async_write_active_min_dirty_percent30
    vfs.zfs.vdev.mirror.non_rotating_seek_inc1
    vfs.zfs.vdev.mirror.non_rotating_inc    0
    vfs.zfs.vdev.mirror.rotating_seek_offset1048576
    vfs.zfs.vdev.mirror.rotating_seek_inc   5
    vfs.zfs.vdev.mirror.rotating_inc        0
    vfs.zfs.vdev.trim_on_init               1
    vfs.zfs.vdev.cache.bshift               16
    vfs.zfs.vdev.cache.size                 16777216
    vfs.zfs.vdev.cache.max                  16384
    vfs.zfs.vdev.default_ms_shift           29
    vfs.zfs.vdev.min_ms_count               16
    vfs.zfs.vdev.max_ms_count               200
    vfs.zfs.txg.timeout                     5
    vfs.zfs.space_map_ibs                   14
    vfs.zfs.spa_allocators                  4
    vfs.zfs.spa_min_slop                    134217728
    vfs.zfs.spa_slop_shift                  5
    vfs.zfs.spa_asize_inflation             24
    vfs.zfs.deadman_enabled                 1
    vfs.zfs.deadman_checktime_ms            5000
    vfs.zfs.deadman_synctime_ms             1000000
    vfs.zfs.debugflags                      0
    vfs.zfs.recover                         0
    vfs.zfs.spa_load_verify_data            1
    vfs.zfs.spa_load_verify_metadata        1
    vfs.zfs.spa_load_verify_maxinflight     10000
    vfs.zfs.max_missing_tvds_scan           0
    vfs.zfs.max_missing_tvds_cachefile      2
    vfs.zfs.max_missing_tvds                0
    vfs.zfs.spa_load_print_vdev_tree        0
    vfs.zfs.ccw_retry_interval              300
    vfs.zfs.check_hostid                    1
    vfs.zfs.mg_fragmentation_threshold      85
    vfs.zfs.mg_noalloc_threshold            0
    vfs.zfs.condense_pct                    200
    vfs.zfs.metaslab_sm_blksz               4096
    vfs.zfs.metaslab.bias_enabled           1
    vfs.zfs.metaslab.lba_weighting_enabled  1
    vfs.zfs.metaslab.fragmentation_factor_enabled1
    vfs.zfs.metaslab.preload_enabled        1
    vfs.zfs.metaslab.preload_limit          3
    vfs.zfs.metaslab.unload_delay           8
    vfs.zfs.metaslab.load_pct               50
    vfs.zfs.metaslab.min_alloc_size         33554432
    vfs.zfs.metaslab.df_free_pct            4
    vfs.zfs.metaslab.df_alloc_threshold     131072
    vfs.zfs.metaslab.debug_unload           0
    vfs.zfs.metaslab.debug_load             0
    vfs.zfs.metaslab.fragmentation_threshold70
    vfs.zfs.metaslab.force_ganging          16777217
    vfs.zfs.free_bpobj_enabled              1
    vfs.zfs.free_max_blocks                 -1
    vfs.zfs.zfs_scan_checkpoint_interval    7200
    vfs.zfs.zfs_scan_legacy                 0
    vfs.zfs.no_scrub_prefetch               0
    vfs.zfs.no_scrub_io                     0
    vfs.zfs.resilver_min_time_ms            3000
    vfs.zfs.free_min_time_ms                1000
    vfs.zfs.scan_min_time_ms                5000
    vfs.zfs.scan_idle                       0
    vfs.zfs.scrub_delay                     0
    vfs.zfs.resilver_delay                  2
    vfs.zfs.top_maxinflight                 512
    vfs.zfs.zfetch.array_rd_sz              1048576
    vfs.zfs.zfetch.max_idistance            67108864
    vfs.zfs.zfetch.max_distance             8388608
    vfs.zfs.zfetch.min_sec_reap             2
    vfs.zfs.zfetch.max_streams              8
    vfs.zfs.prefetch_disable                0
    vfs.zfs.delay_scale                     500000
    vfs.zfs.delay_min_dirty_percent         60
    vfs.zfs.dirty_data_sync                 67108864
    vfs.zfs.dirty_data_max_percent          10
    vfs.zfs.dirty_data_max_max              4294967296
    vfs.zfs.dirty_data_max                  855968972
    vfs.zfs.max_recordsize                  1048576
    vfs.zfs.default_ibs                     17
    vfs.zfs.default_bs                      9
    vfs.zfs.send_holes_without_birth_time   1
    vfs.zfs.mdcomp_disable                  0
    vfs.zfs.per_txg_dirty_frees_percent     30
    vfs.zfs.nopwrite_enabled                1
    vfs.zfs.dedup.prefetch                  1
    vfs.zfs.dbuf_cache_lowater_pct          10
    vfs.zfs.dbuf_cache_hiwater_pct          10
    vfs.zfs.dbuf_metadata_cache_overflow    0
    vfs.zfs.dbuf_metadata_cache_shift       6
    vfs.zfs.dbuf_cache_shift                5
    vfs.zfs.dbuf_metadata_cache_max_bytes   67108864
    vfs.zfs.dbuf_cache_max_bytes            134217728
    vfs.zfs.arc_min_prescient_prefetch_ms   6
    vfs.zfs.arc_min_prefetch_ms             1
    vfs.zfs.l2c_only_size                   0
    vfs.zfs.mfu_ghost_data_esize            0
    vfs.zfs.mfu_ghost_metadata_esize        4181507072
    vfs.zfs.mfu_ghost_size                  4181507072
    vfs.zfs.mfu_data_esize                  1823272960
    vfs.zfs.mfu_metadata_esize              71168
    vfs.zfs.mfu_size                        2356339712
    vfs.zfs.mru_ghost_data_esize            45686784
    vfs.zfs.mru_ghost_metadata_esize        67683328
    vfs.zfs.mru_ghost_size                  113370112
    vfs.zfs.mru_data_esize                  153326080
    vfs.zfs.mru_metadata_esize              559053824
    vfs.zfs.mru_size                        853566464
    vfs.zfs.anon_data_esize                 0
    vfs.zfs.anon_metadata_esize             0
    vfs.zfs.anon_size                       42271744
    vfs.zfs.l2arc_norw                      0
    vfs.zfs.l2arc_feed_again                1
    vfs.zfs.l2arc_noprefetch                0
    vfs.zfs.l2arc_feed_min_ms               200
    vfs.zfs.l2arc_feed_secs                 1
    vfs.zfs.l2arc_headroom                  2
    vfs.zfs.l2arc_write_boost               32000000
    vfs.zfs.l2arc_write_max                 8388608
    vfs.zfs.arc_meta_strategy               0
    vfs.zfs.arc_meta_limit                  1073741824
    vfs.zfs.arc_free_target                 43431
    vfs.zfs.arc_kmem_cache_reap_retry_ms    0
    vfs.zfs.compressed_arc_enabled          1
    vfs.zfs.arc_grow_retry                  60
    vfs.zfs.arc_shrink_shift                7
    vfs.zfs.arc_average_blocksize           8192
    vfs.zfs.arc_no_grow_shift               5
    vfs.zfs.arc_min                         536870912
    vfs.zfs.arc_max                         4294967296
    vfs.zfs.abd_chunk_size                  1024
    vfs.zfs.abd_scatter_enabled             1

------------------------------------------------------------------------


Borja Marcos

Contributor
Joined
Nov 24, 2014
Messages
125
My fault was to use a l2arc in the first place.

It seems that the latest updates have made l2arc more detrimental in relatively low RAM situations. And yes, in those cases in which l2arc is not recommended in the first place, scrub prefetch can make the situation worse.

But the blame should go to the improper usage of a l2arc, not to the scrub prefetch instead.

Sorry for the confusion and false alarm, although I still think that this lesson can be included in the guidelines for NOT using a l2arc for she sake of it :)
 
Top