sfcredfox
Patron
- Joined
- Aug 26, 2014
- Messages
- 340
I recently noticed FreeNAS displaying a very low ARC size after doing some version upgrades and updates, and after googling the hell out of what some of the tunables do, I need some specific guidance.
I just noticed that FreeNAS is reporting it has an ARC size of 17GB, which seems low since the system has 72GB of RAM. I do have 2 (120GB) L2ARC devices attached to two pools, but I can't imagine the table is eating up that much RAM. My first thought is that autotune has gone out of control. "AUTOTUNE, Oh God!" Please keep reading, there's a reason.
A while ago, I had to enable autotune (at the direction of some very reputable folks on this forum) to help correct a system stability issue. This system's primary purpose is to server up datastores for VMware over fibre channel. We thought the system was running out of memory, as kernal panics were happening and FreeNAS was locking up under specific heavy loads like a bunch of simultaneous VM snapshot removals, but under every other heavy load, the system would otherwise be just fine running all the VMs. Anyway, we enabled autotune, it applied a few settings, and all was fine.
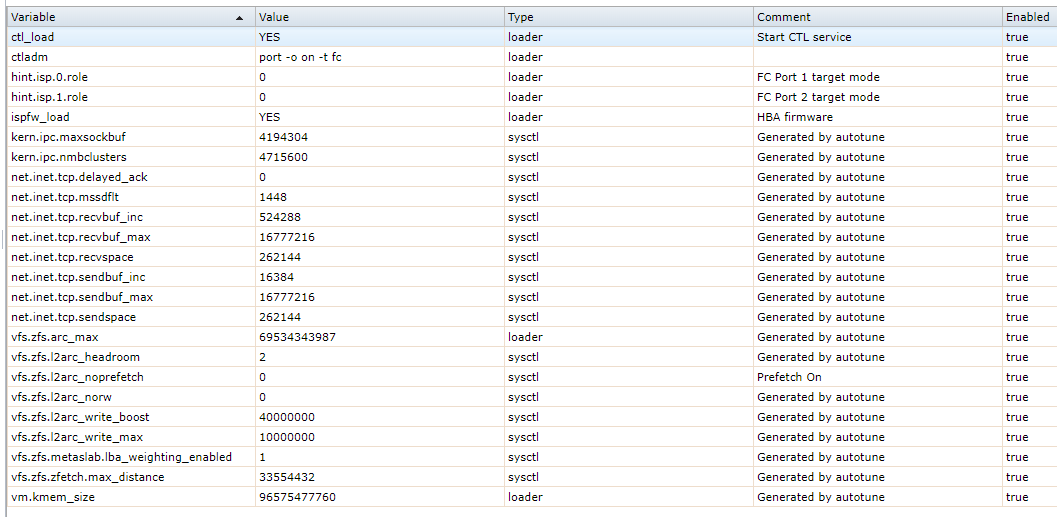
Now after upgrades, I noticed a bunch of new settings that I don't think were there before. (I thought I had disabled it so no new setting would be applied, but I guess not?) Anyway, now all these settings are applied, and I'm trying to figure out which one might be causing a bunch of RAM to be eaten up by something other than ARC and the table for the L2's.
Here's what's applied:

I've been trying to look up what might soak up memory, but I figured I better ask someone who knows better than google. Maybe the issues is none of these.
I included the output of arc_summary and arcstat sizes
Thanks in advance.
I just noticed that FreeNAS is reporting it has an ARC size of 17GB, which seems low since the system has 72GB of RAM. I do have 2 (120GB) L2ARC devices attached to two pools, but I can't imagine the table is eating up that much RAM. My first thought is that autotune has gone out of control. "AUTOTUNE, Oh God!" Please keep reading, there's a reason.
A while ago, I had to enable autotune (at the direction of some very reputable folks on this forum) to help correct a system stability issue. This system's primary purpose is to server up datastores for VMware over fibre channel. We thought the system was running out of memory, as kernal panics were happening and FreeNAS was locking up under specific heavy loads like a bunch of simultaneous VM snapshot removals, but under every other heavy load, the system would otherwise be just fine running all the VMs. Anyway, we enabled autotune, it applied a few settings, and all was fine.
Now after upgrades, I noticed a bunch of new settings that I don't think were there before. (I thought I had disabled it so no new setting would be applied, but I guess not?) Anyway, now all these settings are applied, and I'm trying to figure out which one might be causing a bunch of RAM to be eaten up by something other than ARC and the table for the L2's.
Here's what's applied:
I've been trying to look up what might soak up memory, but I figured I better ask someone who knows better than google. Maybe the issues is none of these.
I included the output of arc_summary and arcstat sizes
Code:
root@Carmel-SANG2:~ # arc_summary.py
System Memory:

		0.11%   77.79   MiB Active,	 0.29%   211.39  MiB Inact
		98.28%  68.94   GiB Wired,	  0.00%   0	   Bytes Cache
		1.02%   732.84  MiB Free,	   0.29%   211.03  MiB Gap

		Real Installed:						 80.00   GiB
		Real Available:				 89.94%  71.95   GiB
		Real Managed:				   97.48%  70.14   GiB

		Logical Total:						  80.00   GiB
		Logical Used:				   98.85%  79.08   GiB
		Logical Free:				   1.15%   944.23  MiB

Kernel Memory:								  1.11	GiB
		Data:						   96.64%  1.08	GiB
		Text:						   3.36%   38.23   MiB

Kernel Memory Map:							  89.94   GiB
		Size:						   1.72%   1.55	GiB
		Free:						   98.28%  88.40   GiB
																Page:  1
------------------------------------------------------------------------

ARC Summary: (HEALTHY)
		Storage pool Version:				   5000
		Filesystem Version:					 5
		Memory Throttle Count:				  0

ARC Misc:
		Deleted:								168.35m
		Mutex Misses:						   526.73k
		Evict Skips:							526.73k

ARC Size:							   27.03%  17.51   GiB
		Target Size: (Adaptive)		 27.20%  17.61   GiB
		Min Size (Hard Limit):		  12.50%  8.09	GiB
		Max Size (High Water):		  8:1	 64.76   GiB

ARC Size Breakdown:
		Recently Used Cache Size:	   86.12%  15.17   GiB
		Frequently Used Cache Size:	 13.88%  2.44	GiB

ARC Hash Breakdown:
		Elements Max:						   20.88m
		Elements Current:			   67.43%  14.08m
		Collisions:							 418.16m
		Chain Max:							  10
		Chains:								 3.44m
																Page:  2
------------------------------------------------------------------------

ARC Total accesses:									 877.07m
		Cache Hit Ratio:				60.26%  528.54m
		Cache Miss Ratio:			   39.74%  348.53m
		Actual Hit Ratio:			   50.46%  442.56m

		Data Demand Efficiency:		 63.67%  415.74m
		Data Prefetch Efficiency:	   62.21%  270.35m

		CACHE HITS BY CACHE LIST:
		  Anonymously Used:			 9.54%   50.40m
		  Most Recently Used:		   36.80%  194.50m
		  Most Frequently Used:		 46.93%  248.07m
		  Most Recently Used Ghost:	 1.67%   8.85m
		  Most Frequently Used Ghost:   5.06%   26.73m

		CACHE HITS BY DATA TYPE:
		  Demand Data:				  50.08%  264.72m
		  Prefetch Data:				31.82%  168.18m
		  Demand Metadata:			  17.27%  91.27m
		  Prefetch Metadata:			0.83%   4.38m

		CACHE MISSES BY DATA TYPE:
		  Demand Data:				  43.33%  151.02m
		  Prefetch Data:				29.32%  102.18m
		  Demand Metadata:			  26.94%  93.88m
		  Prefetch Metadata:			0.42%   1.45m
																Page:  3
------------------------------------------------------------------------

L2 ARC Summary: (HEALTHY)
		Passed Headroom:						6.58m
		Tried Lock Failures:					5.56m
		IO In Progress:						 46
		Low Memory Aborts:					  167
		Free on Write:						  149.13k
		Writes While Full:					  32.88k
		R/W Clashes:							0
		Bad Checksums:						  0
		IO Errors:							  0
		SPA Mismatch:						   8.68b

L2 ARC Size: (Adaptive)						 179.14  GiB
		Header Size:					0.49%   893.76  MiB
Code:
root@Carmel-SANG2:~ # arcstat.py -f arcsz,l2size
arcsz  l2size
  17G	178G
Thanks in advance.
