ARC Size/consumption and performance

sfcredfox

Patron
Joined
Aug 26, 2014
Messages
340
Experts,

I can't figure out what's going on with ARC on my system. I imagine I have to be doing something wrong, but can't figure out what it is.

System config in signature below.

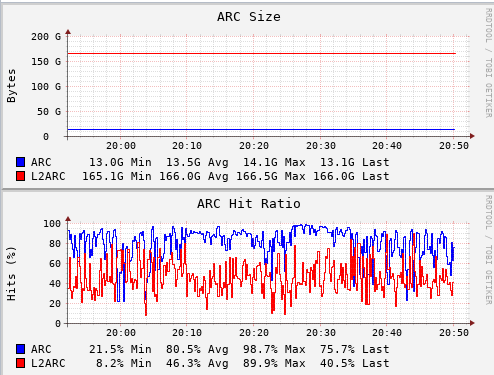
I have 72GB of RAM, ARC starts in the low 60GB range when the system first loads, it ends up being around 12-13GB after a long period of time.

The system has three pools. Two pools have a SLOG and L2ARC which is a 120GB SSD for each one (total of 2 120GB SSDs), these two pools are used for VMware connected over FC. Complete range of windows server VMs (DCs, SQLs, Exchange, File servers, etc)

I figured I was smoking the ARC by having too large of L2ARCs, but if I'm reading the summary output correctly, it should only be using 821MB right? (L2 ARC Size / Header Size?)

I have included ARC Summary report:
Code:
root@Carmel-SANG2:~ # arc_summary.py
System Memory:

		0.05%   32.40   MiB Active,	 0.30%   218.56  MiB Inact
		98.66%  69.20   GiB Wired,	  0.00%   0	   Bytes Cache
		0.92%   659.08  MiB Free,	   0.08%   55.41   MiB Gap

		Real Installed:						 80.00   GiB
		Real Available:				 89.94%  71.95   GiB
		Real Managed:				   97.48%  70.14   GiB

		Logical Total:						  80.00   GiB
		Logical Used:				   98.93%  79.14   GiB
		Logical Free:				   1.07%   877.64  MiB

Kernel Memory:								  1.07	GiB
		Data:						   96.52%  1.04	GiB
		Text:						   3.48%   38.23   MiB

Kernel Memory Map:							  70.14   GiB
		Size:						   2.15%   1.51	GiB
		Free:						   97.85%  68.63   GiB
																Page:  1
------------------------------------------------------------------------

ARC Summary: (HEALTHY)
		Storage pool Version:				   5000
		Filesystem Version:					 5
		Memory Throttle Count:				  0

ARC Misc:
		Deleted:								153.38m
		Mutex Misses:						   159.79k
		Evict Skips:							159.79k

ARC Size:							   20.72%  13.42   GiB
		Target Size: (Adaptive)		 20.85%  13.51   GiB
		Min Size (Hard Limit):		  12.50%  8.09	GiB
		Max Size (High Water):		  8:1	 64.76   GiB

ARC Size Breakdown:
		Recently Used Cache Size:	   85.44%  11.54   GiB
		Frequently Used Cache Size:	 14.56%  1.97	GiB

ARC Hash Breakdown:
		Elements Max:						   18.54m
		Elements Current:			   65.89%  12.22m
		Collisions:							 415.29m
		Chain Max:							  11
		Chains:								 2.78m
																Page:  2
------------------------------------------------------------------------

ARC Total accesses:									 740.13m
		Cache Hit Ratio:				55.99%  414.38m
		Cache Miss Ratio:			   44.01%  325.76m
		Actual Hit Ratio:			   49.10%  363.43m

		Data Demand Efficiency:		 60.55%  371.00m
		Data Prefetch Efficiency:	   51.91%  176.86m

		CACHE HITS BY CACHE LIST:
		  Anonymously Used:			 5.95%   24.66m
		  Most Recently Used:		   43.35%  179.65m
		  Most Frequently Used:		 44.35%  183.78m
		  Most Recently Used Ghost:	 1.96%   8.12m
		  Most Frequently Used Ghost:   4.38%   18.16m

		CACHE HITS BY DATA TYPE:
		  Demand Data:				  54.21%  224.64m
		  Prefetch Data:				22.16%  91.81m
		  Demand Metadata:			  22.68%  93.98m
		  Prefetch Metadata:			0.95%   3.95m

		CACHE MISSES BY DATA TYPE:
		  Demand Data:				  44.93%  146.37m
		  Prefetch Data:				26.11%  85.05m
		  Demand Metadata:			  28.66%  93.35m
		  Prefetch Metadata:			0.30%   988.93k
																Page:  3
------------------------------------------------------------------------

L2 ARC Summary: (HEALTHY)
		Passed Headroom:						5.93m
		Tried Lock Failures:					5.72m
		IO In Progress:						 9
		Low Memory Aborts:					  161
		Free on Write:						  145.50k
		Writes While Full:					  19.10k
		R/W Clashes:							0
		Bad Checksums:						  0
		IO Errors:							  0
		SPA Mismatch:						   8.65b

L2 ARC Size: (Adaptive)						 166.25  GiB
		Header Size:					0.48%   821.29  MiB


I also keep seeing an error in the output:

: main()
File "/usr/local/www/freenasUI/tools/arc_summary.py", line 1197, in main
_call_all(Kstat)
File "/usr/local/www/freenasUI/tools/arc_summary.py", line 1153, in _call_all
unsub(Kstat)
File "/usr/local/www/freenasUI/tools/arc_summary.py", line 926, in _l2arc_summary
if int(arc["l2_arc_evicts"]['lock_retries']) + int(arc["l2_arc_evicts"]["reading"]) > 0:
ValueError: invalid literal for int() with base 10: '4.42k'

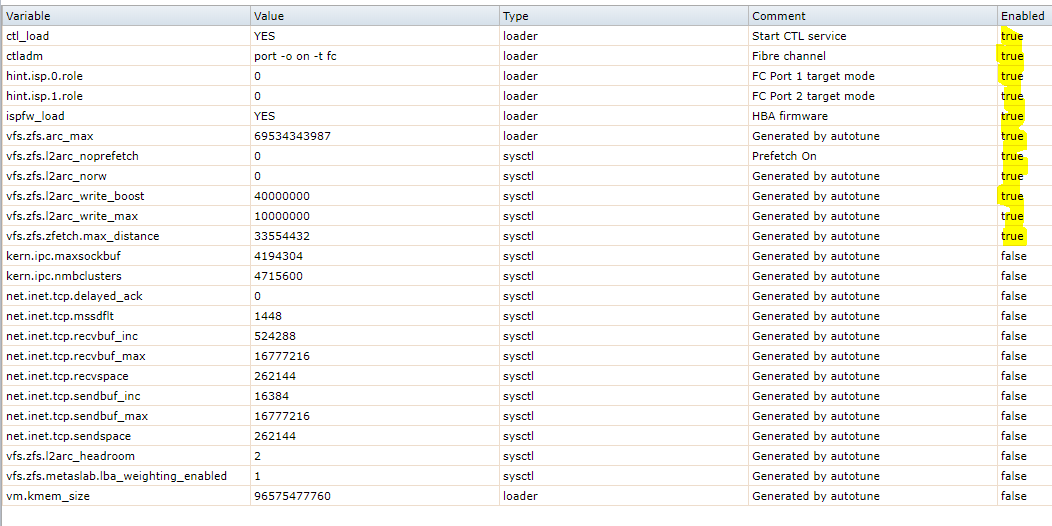
Here's the tunables set:
upload_2018-1-24_20-42-15.png

Notice most of it's disabled, but after trying to research all the settings, I can't figure out what would be telling it to use 40-50 some GB of ARC.

1. What other reports can I run or where can we look to see why there is only 13GB of ARC rather than 60ish?
2. Should I ditch L2ARC based on your opinion of summary output? I've read so many posts and pages of people discussing L2 and performance and still can't get a full understanding of how to evaluate whether it's doing me any good or not. I guess I'm too stupid to understand some of the postings about it, sorry :/

ARC GUI Report:
upload_2018-1-24_20-52-33.png
 
Last edited:

bigphil

Patron
Joined
Jan 30, 2014
Messages
486
What version of FreeNAS? If it's 11.1, I'd upgrade to 11.1-U1 as there was a memory leak that was fixed that caused low ARC usage like your seeing.
 

Morpheus187

Explorer
Joined
Mar 11, 2016
Messages
61
Hello Guys

I'm experience something similar at a system at work.
After reboot ARC went up to use the whole ~60 GB of RAM and now after 3 days of running it's down to about 14GB
Code:
Mem: 7876M Active, 31G Inact, 1136M Laundry, 22G Wired, 560M Free
ARC: 14G Total, 172M MFU, 12G MRU, 7472K Anon, 357M Header, 1515M Other
	 8422M Compressed, 13G Uncompressed, 1.59:1 Ratio
Swap: 10G Total, 10G Free


I'm not entirely sure if that behaviour isn't normal in my use case, I'm using the box to backup large amounts of files, more than 100 Million small files.
I also just added an L2ARC 128GB SSD to check if it affects performance in any way, but the ARC was shrinking before that.

I'm using the latest version FreeNAS-11.1-U1

I'm just wondering why there is 31G Ram reported as "Inact"?

arc_summary.py
Code:
System Memory:

		9.44%   5.88	GiB Active,	 47.91%  29.84   GiB Inact
		39.18%  24.40   GiB Wired,	  0.00%   0	   Bytes Cache
		1.70%   1.06	GiB Free,	   1.78%   1.11	GiB Gap

		Real Installed:						 64.00   GiB
		Real Available:				 99.86%  63.91   GiB
		Real Managed:				   97.44%  62.28   GiB

		Logical Total:						  64.00   GiB
		Logical Used:				   51.73%  33.11   GiB
		Logical Free:				   48.27%  30.89   GiB

Kernel Memory:								  1.72	GiB
		Data:						   97.83%  1.69	GiB
		Text:						   2.17%   38.23   MiB

Kernel Memory Map:							  79.89   GiB
		Size:						   6.06%   4.84	GiB
		Free:						   93.94%  75.05   GiB
																Page:  1
------------------------------------------------------------------------

ARC Summary: (HEALTHY)
		Storage pool Version:				   5000
		Filesystem Version:					 5
		Memory Throttle Count:				  0

ARC Misc:
		Deleted:								150.80m
		Mutex Misses:						   914.09k
		Evict Skips:							914.09k

ARC Size:							   29.32%  16.87   GiB
		Target Size: (Adaptive)		 29.30%  16.85   GiB
		Min Size (Hard Limit):		  13.32%  7.66	GiB
		Max Size (High Water):		  7:1	 57.52   GiB

ARC Size Breakdown:
		Recently Used Cache Size:	   89.21%  15.05   GiB
		Frequently Used Cache Size:	 10.79%  1.82	GiB

ARC Hash Breakdown:
		Elements Max:						   9.09m
		Elements Current:			   29.25%  2.66m
		Collisions:							 65.06m
		Chain Max:							  10
		Chains:								 342.40k
																Page:  2
------------------------------------------------------------------------

ARC Total accesses:									 630.85m
		Cache Hit Ratio:				72.40%  456.71m
		Cache Miss Ratio:			   27.60%  174.14m
		Actual Hit Ratio:			   48.02%  302.95m

		Data Demand Efficiency:		 55.21%  41.52m
		Data Prefetch Efficiency:	   4.58%   19.85m

		CACHE HITS BY CACHE LIST:
		  Anonymously Used:			 29.07%  132.78m
		  Most Recently Used:		   30.38%  138.74m
		  Most Frequently Used:		 35.95%  164.21m
		  Most Recently Used Ghost:	 0.79%   3.61m
		  Most Frequently Used Ghost:   3.80%   17.37m

		CACHE HITS BY DATA TYPE:
		  Demand Data:				  5.02%   22.92m
		  Prefetch Data:				0.20%   909.82k
		  Demand Metadata:			  53.08%  242.44m
		  Prefetch Metadata:			41.70%  190.44m

		CACHE MISSES BY DATA TYPE:
		  Demand Data:				  10.68%  18.60m
		  Prefetch Data:				10.88%  18.94m
		  Demand Metadata:			  12.58%  21.91m
		  Prefetch Metadata:			65.86%  114.69m
																Page:  3
------------------------------------------------------------------------

L2 ARC Summary: (HEALTHY)
		Passed Headroom:						17.17k
		Tried Lock Failures:					5.82k
		IO In Progress:						 475
		Low Memory Aborts:					  4
		Free on Write:						  4.97k
		Writes While Full:					  6.78k
		R/W Clashes:							0
		Bad Checksums:						  0
		IO Errors:							  0
		SPA Mismatch:						   1.70m

L2 ARC Size: (Adaptive)						 98.64   GiB
		Header Size:					0.14%   136.83  MiB

L2 ARC Breakdown:							   4.78m
		Hit Ratio:					  0.71%   33.70k
		Miss Ratio:					 99.29%  4.75m
		Feeds:								  11.93k

L2 ARC Buffer:
		Bytes Scanned:						  962.00  GiB
		Buffer Iterations:					  11.93k
		List Iterations:						47.71k
		NULL List Iterations:				   547

L2 ARC Writes:
		Writes Sent:					100.00% 11.59k
																Page:  4
------------------------------------------------------------------------

DMU Prefetch Efficiency:						719.83m
		Hit Ratio:					  3.54%   25.45m
		Miss Ratio:					 96.46%  694.38m

																Page:  5
------------------------------------------------------------------------

																Page:  6
------------------------------------------------------------------------

ZFS Tunable (sysctl):
		kern.maxusers						   4426
		vm.kmem_size							85782761472
		vm.kmem_size_scale					  1
		vm.kmem_size_min						0
		vm.kmem_size_max						1319413950874
		vfs.zfs.vol.immediate_write_sz		  32768
		vfs.zfs.vol.unmap_sync_enabled		  0
		vfs.zfs.vol.unmap_enabled			   1
		vfs.zfs.vol.recursive				   0
		vfs.zfs.vol.mode						2
		vfs.zfs.sync_pass_rewrite			   2
		vfs.zfs.sync_pass_dont_compress		 5
		vfs.zfs.sync_pass_deferred_free		 2
		vfs.zfs.zio.dva_throttle_enabled		1
		vfs.zfs.zio.exclude_metadata			0
		vfs.zfs.zio.use_uma					 1
		vfs.zfs.zil_slog_bulk				   786432
		vfs.zfs.cache_flush_disable			 0
		vfs.zfs.zil_replay_disable			  0
		vfs.zfs.version.zpl					 5
		vfs.zfs.version.spa					 5000
		vfs.zfs.version.acl					 1
		vfs.zfs.version.ioctl				   7
		vfs.zfs.debug						   0
		vfs.zfs.super_owner					 0
		vfs.zfs.immediate_write_sz			  32768
		vfs.zfs.min_auto_ashift				 12
		vfs.zfs.max_auto_ashift				 13
		vfs.zfs.vdev.queue_depth_pct			1000
		vfs.zfs.vdev.write_gap_limit			4096
		vfs.zfs.vdev.read_gap_limit			 32768
		vfs.zfs.vdev.aggregation_limit		  1048576
		vfs.zfs.vdev.trim_max_active			64
		vfs.zfs.vdev.trim_min_active			1
		vfs.zfs.vdev.scrub_max_active		   2
		vfs.zfs.vdev.scrub_min_active		   1
		vfs.zfs.vdev.async_write_max_active	 10
		vfs.zfs.vdev.async_write_min_active	 1
		vfs.zfs.vdev.async_read_max_active	  3
		vfs.zfs.vdev.async_read_min_active	  1
		vfs.zfs.vdev.sync_write_max_active	  10
		vfs.zfs.vdev.sync_write_min_active	  10
		vfs.zfs.vdev.sync_read_max_active	   10
		vfs.zfs.vdev.sync_read_min_active	   10
		vfs.zfs.vdev.max_active				 1000
		vfs.zfs.vdev.async_write_active_max_dirty_percent60
		vfs.zfs.vdev.async_write_active_min_dirty_percent30
		vfs.zfs.vdev.mirror.non_rotating_seek_inc1
		vfs.zfs.vdev.mirror.non_rotating_inc	0
		vfs.zfs.vdev.mirror.rotating_seek_offset1048576
		vfs.zfs.vdev.mirror.rotating_seek_inc   5
		vfs.zfs.vdev.mirror.rotating_inc		0
		vfs.zfs.vdev.trim_on_init			   1
		vfs.zfs.vdev.bio_delete_disable		 0
		vfs.zfs.vdev.bio_flush_disable		  0
		vfs.zfs.vdev.cache.bshift			   16
		vfs.zfs.vdev.cache.size				 0
		vfs.zfs.vdev.cache.max				  16384
		vfs.zfs.vdev.metaslabs_per_vdev		 200
		vfs.zfs.vdev.trim_max_pending		   10000
		vfs.zfs.txg.timeout					 5
		vfs.zfs.trim.enabled					1
		vfs.zfs.trim.max_interval			   1
		vfs.zfs.trim.timeout					30
		vfs.zfs.trim.txg_delay				  32
		vfs.zfs.space_map_blksz				 4096
		vfs.zfs.spa_min_slop					134217728
		vfs.zfs.spa_slop_shift				  5
		vfs.zfs.spa_asize_inflation			 24
		vfs.zfs.deadman_enabled				 1
		vfs.zfs.deadman_checktime_ms			5000
		vfs.zfs.deadman_synctime_ms			 1000000
		vfs.zfs.debug_flags					 0
		vfs.zfs.debugflags					  0
		vfs.zfs.recover						 0
		vfs.zfs.spa_load_verify_data			1
		vfs.zfs.spa_load_verify_metadata		1
		vfs.zfs.spa_load_verify_maxinflight	 10000
		vfs.zfs.ccw_retry_interval			  300
		vfs.zfs.check_hostid					1
		vfs.zfs.mg_fragmentation_threshold	  85
		vfs.zfs.mg_noalloc_threshold			0
		vfs.zfs.condense_pct					200
		vfs.zfs.metaslab.bias_enabled		   1
		vfs.zfs.metaslab.lba_weighting_enabled  1
		vfs.zfs.metaslab.fragmentation_factor_enabled1
		vfs.zfs.metaslab.preload_enabled		1
		vfs.zfs.metaslab.preload_limit		  3
		vfs.zfs.metaslab.unload_delay		   8
		vfs.zfs.metaslab.load_pct			   50
		vfs.zfs.metaslab.min_alloc_size		 33554432
		vfs.zfs.metaslab.df_free_pct			4
		vfs.zfs.metaslab.df_alloc_threshold	 131072
		vfs.zfs.metaslab.debug_unload		   0
		vfs.zfs.metaslab.debug_load			 0
		vfs.zfs.metaslab.fragmentation_threshold70
		vfs.zfs.metaslab.gang_bang			  16777217
		vfs.zfs.free_bpobj_enabled			  1
		vfs.zfs.free_max_blocks				 18446744073709551615
		vfs.zfs.zfs_scan_checkpoint_interval	7200
		vfs.zfs.zfs_scan_legacy				 0
		vfs.zfs.no_scrub_prefetch			   0
		vfs.zfs.no_scrub_io					 0
		vfs.zfs.resilver_min_time_ms			3000
		vfs.zfs.free_min_time_ms				1000
		vfs.zfs.scan_min_time_ms				1000
		vfs.zfs.scan_idle					   50
		vfs.zfs.scrub_delay					 0
		vfs.zfs.resilver_delay				  0
		vfs.zfs.top_maxinflight				 32
		vfs.zfs.delay_scale					 500000
		vfs.zfs.delay_min_dirty_percent		 60
		vfs.zfs.dirty_data_sync				 67108864
		vfs.zfs.dirty_data_max_percent		  10
		vfs.zfs.dirty_data_max_max			  4294967296
		vfs.zfs.dirty_data_max				  4294967296
		vfs.zfs.max_recordsize				  1048576
		vfs.zfs.zfetch.array_rd_sz			  1048576
		vfs.zfs.zfetch.max_idistance			67108864
		vfs.zfs.zfetch.max_distance			 33554432
		vfs.zfs.zfetch.min_sec_reap			 2
		vfs.zfs.zfetch.max_streams			  8
		vfs.zfs.prefetch_disable				0
		vfs.zfs.send_holes_without_birth_time   1
		vfs.zfs.mdcomp_disable				  0
		vfs.zfs.per_txg_dirty_frees_percent	 30
		vfs.zfs.nopwrite_enabled				1
		vfs.zfs.dedup.prefetch				  1
		vfs.zfs.arc_min_prescient_prefetch_ms   6
		vfs.zfs.arc_min_prfetch_ms			  1
		vfs.zfs.l2c_only_size				   0
		vfs.zfs.mfu_ghost_data_esize			2501864960
		vfs.zfs.mfu_ghost_metadata_esize		8975543808
		vfs.zfs.mfu_ghost_size				  11477408768
		vfs.zfs.mfu_data_esize				  41283584
		vfs.zfs.mfu_metadata_esize			  7750656
		vfs.zfs.mfu_size						82355200
		vfs.zfs.mru_ghost_data_esize			1675264
		vfs.zfs.mru_ghost_metadata_esize		2053068800
		vfs.zfs.mru_ghost_size				  2054744064
		vfs.zfs.mru_data_esize				  10799963136
		vfs.zfs.mru_metadata_esize			  42553344
		vfs.zfs.mru_size						16047876096
		vfs.zfs.anon_data_esize				 0
		vfs.zfs.anon_metadata_esize			 0
		vfs.zfs.anon_size					   5657088
		vfs.zfs.l2arc_norw					  0
		vfs.zfs.l2arc_feed_again				1
		vfs.zfs.l2arc_noprefetch				0
		vfs.zfs.l2arc_feed_min_ms			   200
		vfs.zfs.l2arc_feed_secs				 1
		vfs.zfs.l2arc_headroom				  2
		vfs.zfs.l2arc_write_boost			   40000000
		vfs.zfs.l2arc_write_max				 10000000
		vfs.zfs.arc_meta_limit				  15440896512
		vfs.zfs.arc_free_target				 113245
		vfs.zfs.compressed_arc_enabled		  1
		vfs.zfs.arc_grow_retry				  60
		vfs.zfs.arc_shrink_shift				7
		vfs.zfs.arc_average_blocksize		   8192
		vfs.zfs.arc_no_grow_shift			   5
		vfs.zfs.arc_min						 8224654848
		vfs.zfs.arc_max						 61763586048
																Page:  7
------------------------------------------------------------------------


sfcredfox

Patron
Joined
Aug 26, 2014
Messages
340
What version of FreeNAS? If it's 11.1, I'd upgrade to 11.1-U1 as there was a memory leak that was fixed that caused low ARC usage like your seeing.
I'm upgrading to U1 to see if it goes away
 

Morpheus187

Explorer
Joined
Mar 11, 2016
Messages
61
I think my issue has nothing to do with arc, it's the samba server that is using a lot of ram. Maybe that's also the cause of the thread starters issue? if it doesn't go away with upgrading to U1
Code:
PID USERNAME	  THR PRI NICE   SIZE	RES STATE   C   TIME	WCPU COMMAND
24164 root			1  26	0   201G 40937M zio->i  6 196:02  11.88% smbd
 

RegularJoe

Patron
Joined
Aug 19, 2013
Messages
330
samba is a pig, do you have another FreeNAS for CIFS users? If your using that for VMware storage you might not want to mix the IO and memory use. DC, SQL and Exchange means your trying to use FreeNAS as tier 1 storage. TrueNAS is intended for that. Are you doing striped mirrors?
 

tvsjr

Guru
Joined
Aug 29, 2015
Messages
959
samba is a pig, do you have another FreeNAS for CIFS users? If your using that for VMware storage you might not want to mix the IO and memory use. DC, SQL and Exchange means your trying to use FreeNAS as tier 1 storage. TrueNAS is intended for that. Are you doing striped mirrors?
Wat? I have no trouble mixing my SMB use, NFS to my vSphere nodes, and iSCSI as mounted storage on active/passive nodes all on the same box.
 

c32767a

Patron
Joined
Dec 13, 2012
Messages
371
Wat? I have no trouble mixing my SMB use, NFS to my vSphere nodes, and iSCSI as mounted storage on active/passive nodes all on the same box.

+1

The FreeNAS systems we use at $dayjob are built to be a unified storage platform. It takes a good understanding of your workload and some tuning, but it works fine for us. Of course, if you can't or don't want to build it yourself, there's value in buying a commercial product like TrueNAS.

To contribute to the original thread.. There's something funky with SMB in 11.1. Hopefully when we test U1 we'll see improvements.

Also, ZFS manages the ARC in not so obvious ways. You can force it full, but normal workloads don't always result in a full ARC. Here's one of our boxes for the last couple weeks:
Screen Shot 2018-01-27 at 16.49.42.png


This box has 64G of RAM (and a 1T NVMe card). It usually floats around 50G of ARC used once it's "warmed up".

As of 11, we don't have any sysctls or boot tunables related to zfs. Only some networking stuff.
 
Last edited:

sfcredfox

Patron
Joined
Aug 26, 2014
Messages
340
samba is a pig, do you have another FreeNAS for CIFS users? If your using that for VMware storage you might not want to mix the IO and memory use. DC, SQL and Exchange means your trying to use FreeNAS as tier 1 storage. TrueNAS is intended for that. Are you doing striped mirrors?
Yeah, I try to outline that in the system config. One pool has 12 stripes and the other has 6.

This box has 64G of RAM (and a 1T NVMe card). It usually floats around 50G of ARC used once it's "warmed up".
This is similar to what I usually see as well.

The black lines represent reboots. The second one is after applying U1.
upload_2018-1-27_18-58-2.png

Update has thus far shown promise, ARC is holding steady around 53GB.

As of 11, we don't have any sysctls or boot tunables related to zfs. Only some networking stuff.
I would be interested in any pointers on trying to obtain a higher hit percentage hosting VMware datastores, but with all the reading I've been doing, it seems extremely complex.
 

tvsjr

Guru
Joined
Aug 29, 2015
Messages
959
Why do you think that your current hit ratio is bad? I just rebooted earlier today (recabling the rack at home... doesn't everyone need 2 48-port switches to run all their gear?) and I'm up to 126GB in ARC and 133.9GB in L2ARC. Hit ratios are 36.1% for ARC and 0.0% for L2ARC (*meh*). The hit rates will come up over time, as the cache gets more optimized (usually somewhere around 70% for ARC and L2ARC).

Keep in mind that, to FreeNAS, your VMs are just bits and bytes. Lots of the super-smart cache prefetching that some systems performed is based on some sort of behavioral analysis of what files are being accessed. FreeNAS doesn't understand or know about the inner workings of your VM, so it can't do this.

In short - I don't expect you're going to find one magic knob that you can twist and suddenly get 99% cache hit rates immediately following a reboot.
 

teretete

Cadet
Joined
Aug 26, 2017
Messages
6
+1

The FreeNAS systems we use at $dayjob are built to be a unified storage platform. It takes a good understanding of your workload and some tuning, but it works fine for us. Of course, if you can't or don't want to build it yourself, there's value in buying a commercial product like TrueNAS.

To contribute to the original thread.. There's something funky with SMB in 11.1. Hopefully when we test U1 we'll see improvements.

Also, ZFS manages the ARC in not so obvious ways. You can force it full, but normal workloads don't always result in a full ARC. Here's one of our boxes for the last couple weeks:
View attachment 22555

This box has 64G of RAM (and a 1T NVMe card). It usually floats around 50G of ARC used once it's "warmed up".

As of 11, we don't have any sysctls or boot tunables related to zfs. Only some networking stuff.
Would it be possible for you to take a screenshot of your tunables? I have very similar setup here 64G memory and 1TB Nvme and my L2ARC hit ratio sits at 0 most of the time while my ARC is at 99%. I am sure missing something. I use the freenas box to edit videos straight from it. Many 4k footage being loaded at the same time while I am editing on premiere and my playback jitters. I am on a 10GB network connected straight to the Freenas server.

Thank You!
 
Top