SOLVED Understanding the TC 2.0 System Card

Joined
Jan 4, 2014
Messages
1,644
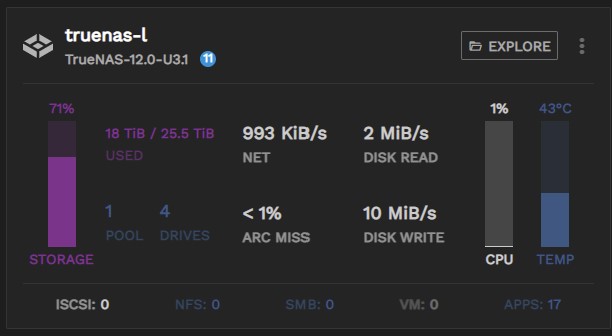
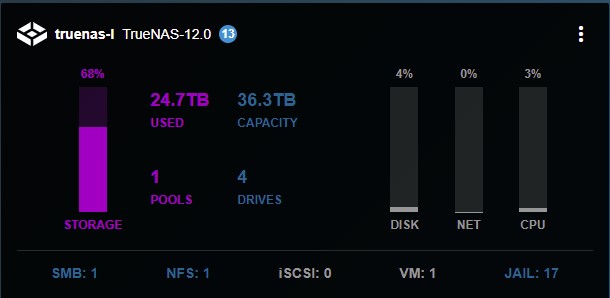
The system card has changed quite dramatically between TC 1.3.2 and 2.0.
tc30.jpg
tc29.jpg


All the information that was previously in 1.3.2 is still there, but there's now more! It's clear a lot of thought has gone into the use of available real estate on the card, without over-cluttering the card. :smile:

I feel, though, there are some gaps in the TC documentation. The System Card section of the TC documentation doesn't offer an explanation on some of the elements on the redesigned card. I'm hoping that the discussion arising from this thread will provide ideas for updating that section of the TC documentation, or TC itself, or both.
  1. What is ARC MISS? What should the sysadmin be looking for with this stat?
  2. What does the TEMP graph refer to? Disk temp? CPU temp? What should the sysadmin be wary of here? There doesn't appear to be a predefined alert rule set up for TEMP (or for ARC MISS in the previous point). While a user-defined rule can be set up, is this just an oversight?
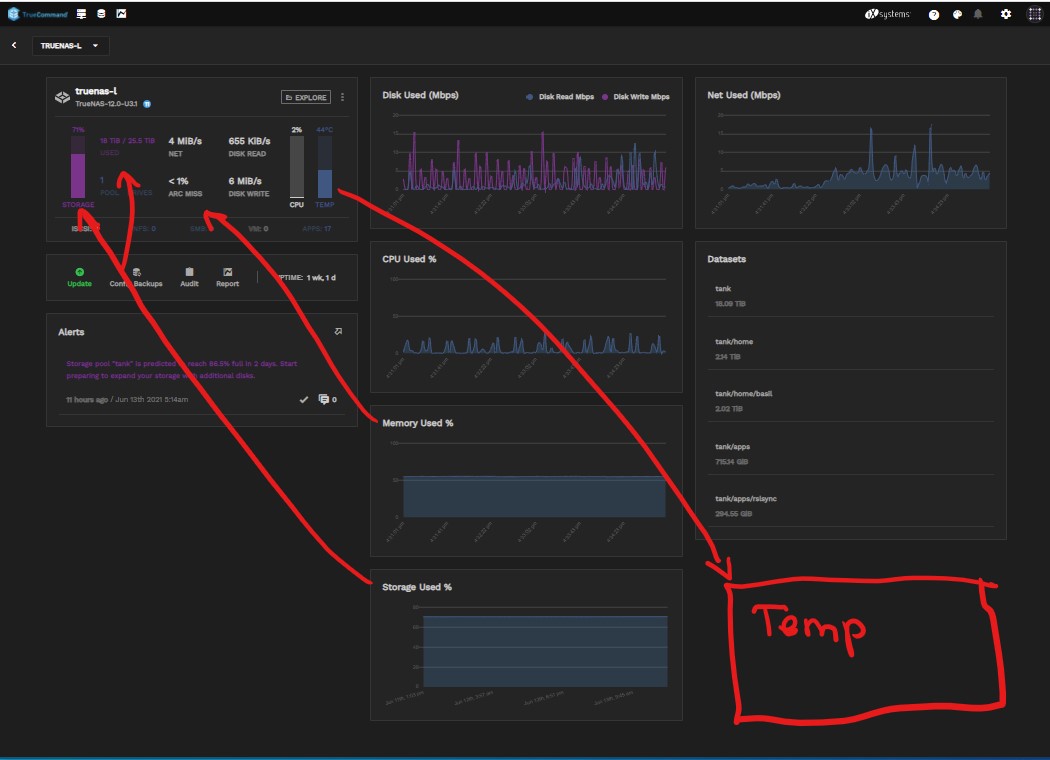
  3. Hot spots on the main body of the card (excluding the header and footer areas) include:
    1. DRIVES, DISK READ and DISK WRITE that all link to the same Disk Activity graph.
    2. NET that links to a Net Activity graph.
    3. CPU that links to a CPU Usage graph.
    4. TEMP that links to a Temp graph. Curiously, when drilling down through a System card, a card for the Temp graph isn't visible in the next layer. Conversely, the Storage Used and Memory Used cards that are visible in this layer don't appear to be hot-spotted to any element on the System card. Could the Storage Used graph be tied to STORAGE and USED on the System Card, and the Memory Used graph tied to ARC MISS? Is it possible to add and remove optional cards to this second layer?
tc31.jpg
 
Last edited:

Etorix

Wizard
Joined
Dec 30, 2020
Messages
2,110
All good point for an improved UI in 2.0.x.
 

aervin

iXsystems
iXsystems
Joined
Jun 13, 2018
Messages
114
I think adding the storage graph pop up to the cards is a great idea.

TEMP = CPU temperature. Unsure of the best way to make this clearer, presently. Even two-word labels, such as "CPU TEMP," can make the card layout a little weird.

Is timeseries CPU temp data something y'all want on the single-system dash? I see no problem with putting it under the Datasets card like @Basil Hendroff suggests. We're also open to ideas for dash metrics. We can't fit every idea into the layout though :smile: .

Thanks for the feedback as always!
 
Joined
Jan 4, 2014
Messages
1,644
Unsure of the best way to make this clearer, presently. Even two-word labels, such as "CPU TEMP," can make the card layout a little weird.
Ahh, so this is CPU temp. Personally, I don't have a problem with the TEMP label, however, the TC doc System Card section could provide some additional clarification.

Is timeseries CPU temp data something y'all want on the single-system dash?
I'm fine either way. The query from me was more around a consistent approach between the system card and the datasets layer. Is this the preferred name for this layer? I could find no reference to this layer in the TC doc.

@aervin Can you offer some suggestions for threshold values for ARC MISS and TEMP as I'd like to add some rules around these?
 
Last edited:

Etorix

Wizard
Joined
Dec 30, 2020
Messages
2,110
"TEMP" is close to "CPU", and is a single value, so the context is clear.
HDD temperature report would be good idea, but would require its own whole card, or a multicolour graph to report temperature for each drive.
 
Joined
Jan 4, 2014
Messages
1,644
tc57.png


I use to call these system tiles. I understand from the TC documentation that the preferred term is System Cards. I struggled to find names for the highlighted elements on the card though:
  1. The documentation refers to this as the Updating Wheel. I haven't warmed to this term. Sure, the wheel appears when the system is updating, but it also appears during scrubs, resilver and replication. I wonder if the term Activity Wheel might be better, or something else?
  2. Thanks to @kenmoore in JIRA ticket TC-1760, I now know this as the Alerts bubble, a term I really like.
The collective view of system cards is referred to in the documentation as the TrueCommand Dashboard. When drilling down on a system card, we're presented with a collective view of cards for the system.

tc62.jpg


Scouring the documentation, I can find no reference to this view. I'm struggling to name it. At different times I've referred to it as the 'drill-down view' and 'datasets layer', neither term which I've warmed to. Is there a name, preferred by iXsystems, for this view?

Apart from the name, thinking out aloud (while sneakily planting a seed in the mind of TC engineers :wink:), what I'd love to see in this view, in some future incarnation of TC way down the track, are the following:
  1. The ability to rearrange cards; and
  2. The ability to swap in and out optional cards.
For the moment, I'd be happy with just a name for this view. :smile:

Logged under JIRA ticket TC-1782.
 
Last edited:
Joined
Jan 4, 2014
Messages
1,644
Last edited:
Top