'Reporting' gui page reporting jails that have been deleted

Status
Not open for further replies.

tophee

Explorer
Joined
Oct 27, 2011
Messages
71
Hi Guys,

I upgraded to 9.1.0-Release the other day and got into a pickle with my jails/plugins.

I was running 8.3.1 since shortly after it was released and I had minidlna and firefly running perfectly.
I upgraded and messed up my jail/plugin upgrade and realised that I should have run the upgrade script from shell. Once I did that I was able to delete the old jails and plugins (I wanted a fresh start on them).

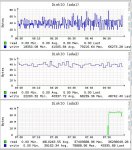
My 8.3.1 system had a jail and software volume setup for them. However since deleting these volumes, they still appear in the 'Reporting' page of FreeNAS. As I had made several attempts to re-setup my plugins, I have ended up with several 'volumes' being reported in gui that don't exist. Each entry reports the space as "nan B min". As shown below:

FreeNAS-Empty Reports.png


How does one go about removing these entries?

Thanks.
 
D

dlavigne

Guest
Not sure how to remove them, but it looks like a bug that should be reported at support.freenas.org. Do a search first to make sure that this has not already been reported.
 

emk2203

Guru
Joined
Nov 11, 2012
Messages
573
I am also affected by this bug - it seems to be more than just a single occurrence.

In the closed ticket #279 (no gui way to delete and reset reporting data) is a recommendation by gcooper to use

Code:
/usr/local/etc/rc.d/collectd stop && find /var/db/collectd/rrd/localhost/* -type d | xargs rm -Rf && rm /data/rrd_dir.tar.bz2 && /usr/local/etc/rc.d/collectd start && python /root/graph.py
to reset, but this was 2 years ago, and the last part is out-of-date and gives
Code:
python: can't open file '/root/graph.py': [Errno 2] No such file or directory
.

A reboot fixes this, and everything is back to normal then (all graphs there, no stale graphs, everything working).

Would be nice to start graph.py from the CLI, though.
 

Tom7320

Explorer
Joined
Aug 7, 2013
Messages
52
Sorry but I still don't understand. I have the same problem. How do I reset the Reportings??? What do I have to do?

THX a lot!!
 

emk2203

Guru
Joined
Nov 11, 2012
Messages
573
Open the web interface of your FreeNAS box. Second-to-last in the menu on the left is the shell command. Click it and open the shell on the box.

Enter

Code:
/usr/local/etc/rc.d/collectd stop && find /var/db/collectd/rrd/localhost/* -type d | xargs rm -Rf && rm /data/rrd_dir.tar.bz2 && /usr/local/etc/rc.d/collectd start


which clears your reporting settings. Close the shell (type 'exit'), make a reboot from the web page. After the reboot, the reporting should be back to normal.
 

underpickled

Contributor
Joined
Oct 1, 2013
Messages
167
Open the web interface of your FreeNAS box. Second-to-last in the menu on the left is the shell command. Click it and open the shell on the box.

Enter

Code:
/usr/local/etc/rc.d/collectd stop && find /var/db/collectd/rrd/localhost/* -type d | xargs rm -Rf && rm /data/rrd_dir.tar.bz2 && /usr/local/etc/rc.d/collectd start


which clears your reporting settings. Close the shell (type 'exit'), make a reboot from the web page. After the reboot, the reporting should be back to normal.

This deleted the reporting graphs of things that no longer exist, but now that I've rebooted all of the graphs are blank...

EDIT: Sorry, my impatience got the best of me... it just had to populate... working fine and thank you for the solution! I was also getting inaccurate/weird reports about capacities and they seem to be fixed now.
 

Dusan

Guru
Joined
Jan 29, 2013
Messages
1,165
This deleted the reporting graphs of things that no longer exist, but now that I've rebooted all of the graphs are blank...
That solution is actually a bit overkill -- it removes all the graphs and everything starts from zero.
You can go to /var/db/collectd/rrd/localhost/ and selectively remove directories for only those graphs you want to get rid of. Also, no need to restart collectd and you also do not need to delete the .bz2 file -- it is created based on the current graphs on shutdown.
 

emk2203

Guru
Joined
Nov 11, 2012
Messages
573
That solution is actually a bit overkill -- it removes all the graphs and everything starts from zero.
You can go to /var/db/collectd/rrd/localhost/ and selectively remove directories for only those graphs you want to get rid of. Also, no need to restart collectd and you also do not need to delete the .bz2 file -- it is created based on the current graphs on shutdown.

Yes, I am fully aware of that. However, my google-fu and limited snooping around in the NAS filesystem didn't turn up much besides the nuke-all solution above.

Where do I find more info on the inner workings of FreeNAS?
 
Joined
Dec 23, 2013
Messages
6
Hello,
Thanks for the information in this thread. Worked OK for me to delete old entries for a network card I replaced.
Now, I try to add some disk graphs:
- added "LoadPlugin disk" to /usr/local/etc/collectd.conf (my plan is to make it permanent at boot if the reporting works)
- restarted collectd
- I see disk stats RRD's in /var/db/collectd/rrd/localhost/disk-ada*/
But there is none (yet) on the "Reporting page" in the Web interface.
Is there anything I'm missing ?
TIA.

Lucien
___________________________
FreeNAS-9.1.1-RELEASE-x64 (a752d35)
PEGATRON CORPORATION Narra 6 / 8 Gb [ 2*DDR3@1066 MHz]
AMD Athlon(tm) II X2 215 Processor
Gigabit RealTek
6* 3T disks (WD30EZRX-00D8PB0) : raidz1 + spare
 

Dusan

Guru
Joined
Jan 29, 2013
Messages
1,165
- I see disk stats RRD's in /var/db/collectd/rrd/localhost/disk-ada*/
But there is none (yet) on the "Reporting page" in the Web interface.
Is there anything I'm missing ?
It's not that easy. The GUI does not know how to graph the data (colors, areas, lines, labels, ...). You need to add the graphing code to: /usr/local/www/freenasUI/reporting/rrd.py
 
Joined
Dec 23, 2013
Messages
6
Not yet there :-(

I copied rrd.py to /usr/local/www/freenasUI/reporting/rrd.py after " mount -uw / "
Is there a place where python logs errors ?

I still miss something ... Do I need to reboot ? To restart the web server ?
I'm not sure I understand how the new Class is attached to the rest of the Web server.

The code is (not much of my own, just adapted one for SysLoad) :
 

Dusan

Guru
Joined
Jan 29, 2013
Messages
1,165
You need to restart django by running "service django restart". Django/python error message will be in /var/log/messages, web server error messages are in /var/log/nginx-error.log.
 
Joined
Dec 23, 2013
Messages
6
You need to restart django by running "service django restart". Django/python error message will be in /var/log/messages, web server error messages are in /var/log/nginx-error.log.

Thanks a lot. It works great !
I'll have to take a bit care about numbers' length but that's it.
 

Attachments

  • Capture.JPG
    Capture.JPG
    91.8 KB · Views: 274
Status
Not open for further replies.
Top