Performance whilst being used for CCTV Storage

Status
Not open for further replies.

chriswiggins

Dabbler
Joined
Mar 4, 2018
Messages
11
Hi all,

Quick intro - long time supporter of FreeNAS but only in the past year have I had the privilege of using it in a commercial setting.

We've got 3 iXSystems FreeNAS-Certified boxes purchased last year to store archived CCTV footage from a Milestone XProtect Corporate VMS system. The platform automatically moves CCTV footage every hour across to these NAS boxes from the SAN that the data is written to initially (this is part of Milestone's Live/Archive architecture).

NAS Configuration (3 identical boxes)
2x E5-2609v4 Xeon CPUs
128GB RAM
1 200GB ZIL (Intel S3710)
1 240GB ARC (Intel DC S3520)
24 HGST 8TB NL-SAS (H4K)
1 Dual-port 10G NIC (DAC version)
LSI 9300-8E SAS HBA

These came preconfigured as 4 x raidz2 vdevs, each vdev with 6 drives.

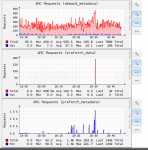
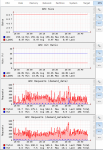
What we're seeing is an increase in read latency recently as we've added more and more cameras onto the platform and based on what I've read I'm wondering if we'd have been better off with 12 mirrored vdevs. The read latency is causing issues with the playback of footage, causing it to stutter and skip ahead. I've lodged a support case with Milestone and waiting to hear more from them but as expected they've initially pointed the finger at our beloved NAS setup!

We have a 10G Juniper switching network between our servers and NAS boxes, running jumbo frames and we see excellent throughput through it. Milestone is configured to use SMB/CIFS as the file share so there's no iSCSI funny business going on.

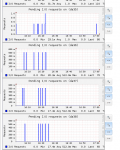
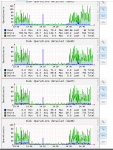
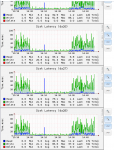
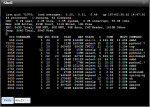
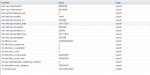
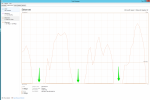
I guess what has me looking at the ZFS setup is the alarming amount of pending I/O requests on some of the disks. It doesn't seem to have any rhyme or reason to it so I'm at a loss as to what could be going on (see attached image). We also don't see the performance bottleneck during periods of no writing activity which is approximately 50% of the time (Milestone is archiving once an hour and this takes about 30 mins)

Any ideas of places to look or things to check would be much appreciated!

Cheers
 

Attachments

  • Pending_IO.png
    Pending_IO.png
    78.1 KB · Views: 355

Ericloewe

Server Wrangler
Moderator
Joined
Feb 15, 2014
Messages
20,194
The simple fix is to simply add a few more vdevs to give you a bit more IOPS. It's a bit of a brute-force solution, though.

How full is the pool?
 

chriswiggins

Dabbler
Joined
Mar 4, 2018
Messages
11
Each pool is nearing on 50% so we’re definitely not running near any capacity limits!

I’ve read all the articles on “only use mirror vdevs” and I’m wondering if I should sort that out sooner rather than later. Just wanting to know if that’ll solve the issue mainly
 

Ericloewe

Server Wrangler
Moderator
Joined
Feb 15, 2014
Messages
20,194
I’ve read all the articles on “only use mirror vdevs” and I’m wondering if I should sort that out sooner rather than later. Just wanting to know if that’ll solve the issue mainly
It might provide better performance, but you'd end up needing more storage anyway, so it might be interesting to start with additional RAIDZ2 vdevs and see how they work.
 

chriswiggins

Dabbler
Joined
Mar 4, 2018
Messages
11
It might provide better performance, but you'd end up needing more storage anyway, so it might be interesting to start with additional RAIDZ2 vdevs and see how they work.
When we need additional storage we'll add more units, so I don't expect any more storage to be used on these particular boxes in the medium-term, so when you say it might provide better performance, is it something worth trying?
 

Ericloewe

Server Wrangler
Moderator
Joined
Feb 15, 2014
Messages
20,194
If you can try it out without too much trouble, definitely do so.
 
Joined
Jan 18, 2017
Messages
525
I think more information might be in order while you were having the playback issue have you monitored the SMB process usage or the disk busy?
 

chriswiggins

Dabbler
Joined
Mar 4, 2018
Messages
11
I think more information might be in order while you were having the playback issue have you monitored the SMB process usage or the disk busy?
Thanks for the advice - here's the numbers during playback. I've attached a `top` screenshot, Disk Busy and disk latency as well
smbd hovers around 20% CPU
Disk Busy for the disks in the vdev hover between 10-20%
 

Attachments

  • disk_ops_during_playback.png
    disk_ops_during_playback.png
    106.3 KB · Views: 344
  • latency_during_playback.png
    latency_during_playback.png
    96.4 KB · Views: 336
  • SMB_During_Playback.png
    SMB_During_Playback.png
    104.7 KB · Views: 316

chriswiggins

Dabbler
Joined
Mar 4, 2018
Messages
11
If you can try it out without too much trouble, definitely do so.
If without too much trouble means very carefully removing 2 disks from each of the 4 RAIDZ2 vdevs and making a stripe, migrating the data to the stripe and then adding the rest of the disks in as a mirror counts, then I guess it's not too much trouble ;) This is why I was hoping to verify how much of a difference this would make :cool:
 

tvsjr

Guru
Joined
Aug 29, 2015
Messages
959
How about the output of zpool list and zpool status? I'm wondering if your fragmentation has gone through the roof?

And pulling two drives off running vdevs is a Bad Idea for a production system. $DEITY forbid something happen during that period, how are you going to explain to the boss that you trashed the pool? If you're spending this sort of money on a CCTV system, I assume you have substantial compliance requirements dictating what you're storing... losing that would be Bad. If you are going to do this, I'd suggest migrating the data off to one of the other servers... or buying new drives and building a new test pool.
 
Joined
Jul 3, 2015
Messages
926
Out of interest what version of FreeNAS are you running and what FW version have you got on your LSI card?
 

chriswiggins

Dabbler
Joined
Mar 4, 2018
Messages
11
Hi Johnny,

We're running 9.10.2-U4 currently. Here is the dmesg | grep mpr output relevant to the firmware:

Code:
mpr0: <Avago Technologies (LSI) SAS3008> port 0x6000-0x60ff mem 0xc7440000-0xc744ffff,0xc7400000-0xc743ffff irq 26 at device 0.0 on pci1
mpr0: IOCFacts  :
mpr0: Firmware: 12.00.02.00, Driver: 15.01.00.00-fbsd
mpr0: IOCCapabilities: 6985c<ScsiTaskFull,DiagTrace,SnapBuf,EEDP,TransRetry,IR,MSIXIndex>
mpr1: <Avago Technologies (LSI) SAS3008> port 0x5000-0x50ff mem 0xc7240000-0xc724ffff,0xc7200000-0xc723ffff irq 32 at device 0.0 on pci2
mpr1: IOCFacts  :
mpr1: Firmware: 12.00.00.00, Driver: 15.01.00.00-fbsd
mpr1: IOCCapabilities: 7a85c<ScsiTaskFull,DiagTrace,SnapBuf,EEDP,TransRetry,EventReplay,MSIXIndex,HostDisc>


Interestingly, this issue goes away when I reboot however re-appears after approx 24 hours. Not sure if that helps at all!
 

sretalla

Powered by Neutrality
Moderator
Joined
Jan 1, 2016
Messages
9,703
I'm not sure if anyone here has noticed, but 500 milli (=0.5) to 1.0 I/O requests outstanding doesn't actually seem that bad to me... clearly if you were seeing that number go up and stay at or above 1.0 for a while it would be something to worry about, but your charts show that it immediately clears and comes back from time to time (I guess while heavy writing is happening).

If it was my system, I'd be sleeping well and not spending time solving something that seems to me not to be an actual problem.
 

Arubial1229

Dabbler
Joined
Jul 3, 2017
Messages
22
I'm not sure if anyone here has noticed, but 500 milli (=0.5) to 1.0 I/O requests outstanding doesn't actually seem that bad to me... clearly if you were seeing that number go up and stay at or above 1.0 for a while it would be something to worry about, but your charts show that it immediately clears and comes back from time to time (I guess while heavy writing is happening).

If it was my system, I'd be sleeping well and not spending time solving something that seems to me not to be an actual problem.

From the OP: The read latency is causing issues with the playback of footage, causing it to stutter and skip ahead.

There is a problem...
 

chriswiggins

Dabbler
Joined
Mar 4, 2018
Messages
11
If it was my system, I'd be sleeping well and not spending time solving something that seems to me not to be an actual problem.

If it was your system and your customer was ringing you every other day complaining about their issues are you *sure* you’d sleep at night? Please try to be helpful I wouldn’t be here asking questions if there wasn’t an issue.

Thanks
 

sretalla

Powered by Neutrality
Moderator
Joined
Jan 1, 2016
Messages
9,703
If it was your system and your customer was ringing you every other day complaining about their issues are you *sure* you’d sleep at night? Please try to be helpful I wouldn’t be here asking questions if there wasn’t an issue.

Thanks
Apologies for having come across as critical or un-helpful. I feel your pain and hadn't caught the part of the post that made the user impact clear.

On the other hand, my comment about not seeing a pending operation queue count of 1 or less as a big problem will still stand, so clearly there's something else going on. I will try to contribute to finding the solution if I can.

Have you already looked at tunable parameters for network buffers?
 

chriswiggins

Dabbler
Joined
Mar 4, 2018
Messages
11
Apologies for having come across as critical or un-helpful. I feel your pain and hadn't caught the part of the post that made the user impact clear.

On the other hand, my comment about not seeing a pending operation queue count of 1 or less as a big problem will still stand, so clearly there's something else going on. I will try to contribute to finding the solution if I can.

Thats ok - it happens and I really do appreciate the help :)

Have you already looked at tunable parameters for network buffers?

I've set Autotune to on (even though I've seen in lots of places not to) one this does modify some of the network buffers (see attached). Changed jumbo frames back to 1500 and this doesn't seem to have any affect (both on the traffic throughput or the issues mentioned above)

I've also attached a graph from one of the Windows servers showing the periods of zero communication from the NAS boxes if this assists

Appreciate the help
 

Attachments

  • tuneables.png
    tuneables.png
    210.6 KB · Views: 304
  • recording server troughs.png
    recording server troughs.png
    781.1 KB · Views: 314

DaveY

Contributor
Joined
Dec 1, 2014
Messages
141
Something looks screwy with your ARC size. Your top is reporting 843G of ARC, but you only have 128GB of memory and a 240G L2ARC. I'm not sure if that's just a reporting error on the part of 'top', but even if it was displaying both ARC and L2ARC combined, it shouldn't be more than 368GB. Can you take a screenshot of your ZFS graphs; mainly the ARC sections?
 

chriswiggins

Dabbler
Joined
Mar 4, 2018
Messages
11
Hi Dave,

This is a really good point - the graphs are showing an L2ARC size of 8.4T!!! Attached are graphs but it looks like this might be where the issue is coming in? Top is now reporting 156GB Total ARC
 

Attachments

  • arc2.png
    arc2.png
    287.6 KB · Views: 298
  • arc1.png
    arc1.png
    707.5 KB · Views: 307

Ericloewe

Server Wrangler
Moderator
Joined
Feb 15, 2014
Messages
20,194
It could very well be compression, if your data compresses very well on disk.
 
Status
Not open for further replies.
Top