-
Important Announcement for the TrueNAS Community.
The TrueNAS Community has now been moved. This forum has become READ-ONLY for historical purposes. Please feel free to join us on the new TrueNAS Community Forums
You are using an out of date browser. It may not display this or other websites correctly.
You should upgrade or use an alternative browser.
You should upgrade or use an alternative browser.
Middlewared having a memory leak in 22.02.0?
- Thread starter Whiskydrinker
- Start date
Thanks for updating the ticket @MountainMan, it looks like you tracked the issue down to the middleware essentially caching the websocket streams in RAM forever. I'd assume there is some background garbage collection that is supposed to discard stale real-time data, but for some reason it doesn't work for a subset of users? It's a bit weird, since the web UI environment should really be identical on all installations. The bug cannot affect the entire userbase though, or we'd be seeing *much* more feedback.
Did you verify the memory usage of the actual middlewared process? The total value reported by the GUI includes other processes as well and might be misleading.I did not leave the browser window open and less than 24 hours later middlewared has climbed another 1.5GB.
I have now - it matches.
Also included is an interesting histogram of CPU and RAM usage. Keep in mind that this system has basically been doing nothing but running badblocks, except for a momentary usage of the smb share. For much of this time the smb service wasn't even active, much less mounted and in use. RAM on the Dashboard has climbed to 22.5 since my last post. The TN browser window has been closed.
I don't know, maybe badblocks caches things in middlewared, maybe this upwards CPU and RAM usage trend is typical for this scenario - I started those runs by first sshing in, sudo -i and then tmux 8 windows.
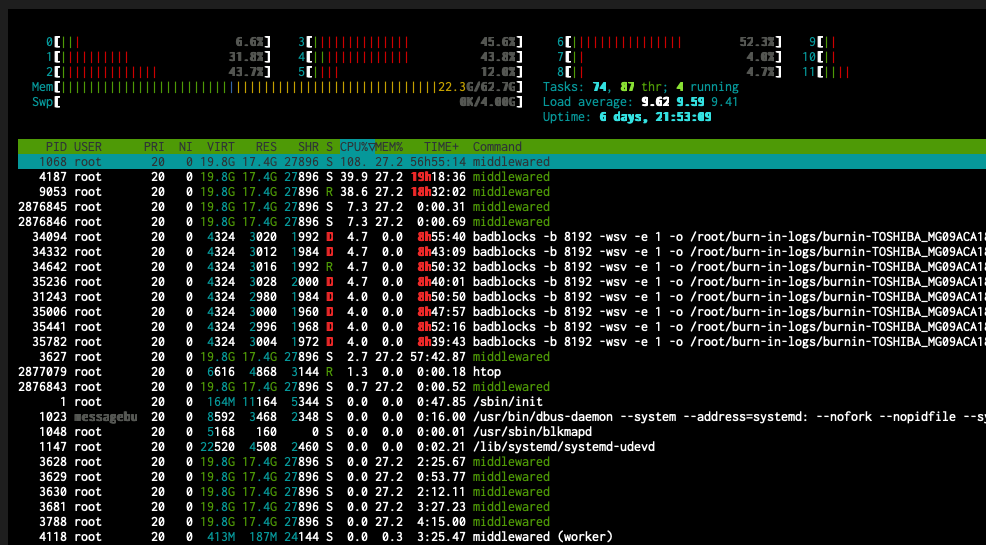
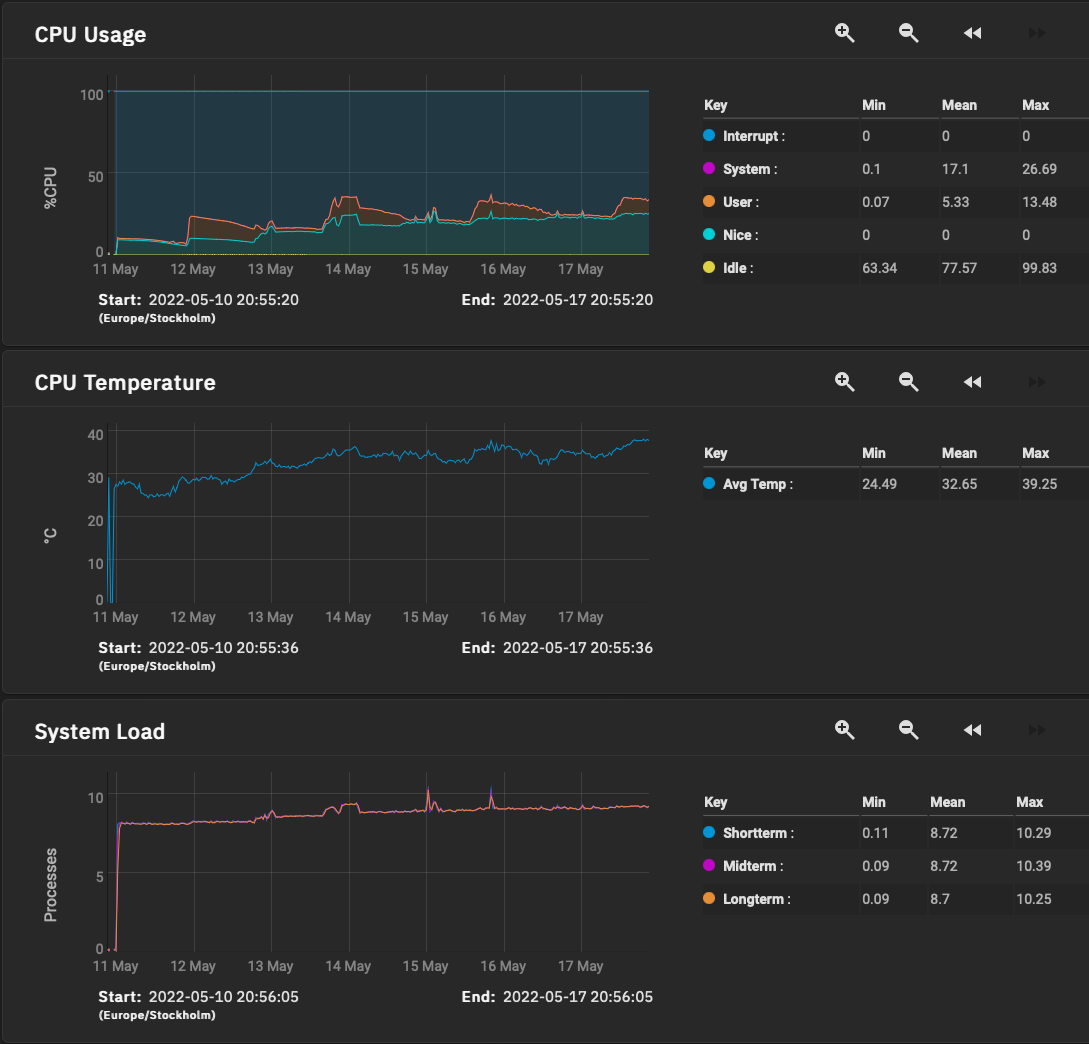
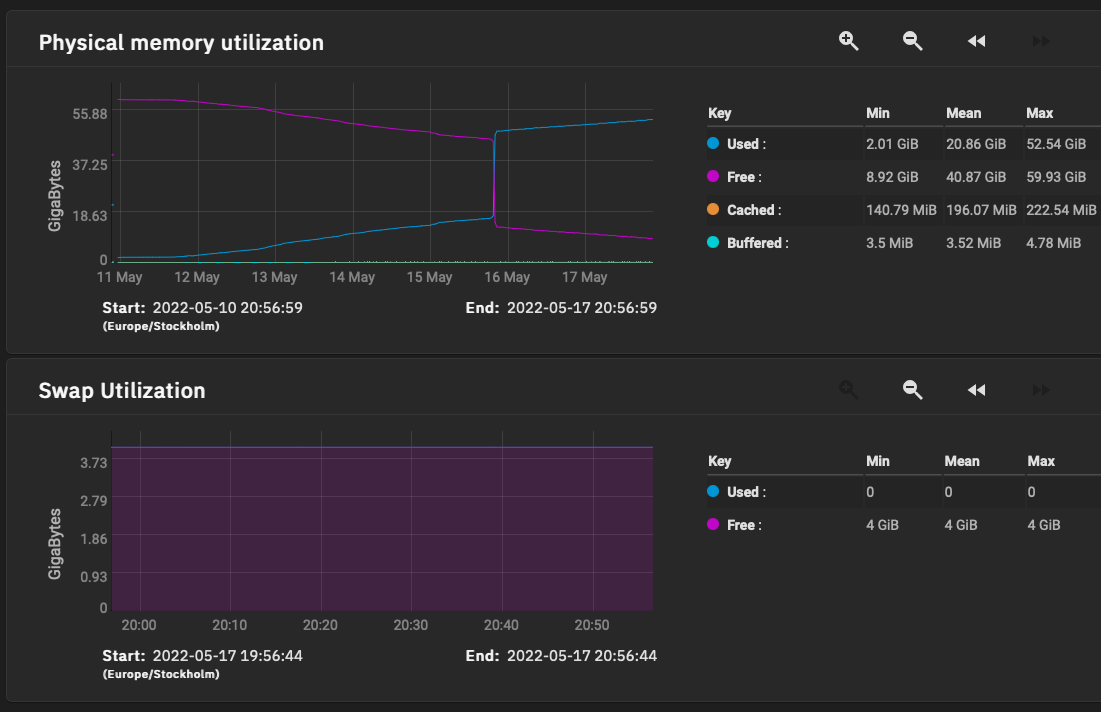
@neofusion: Your workload could be interfering with the measurement. Maybe it's best if you wait for your jobs to conclude, reboot the system and then immediately keep a very close eye on the middlewared RSS. As shown in post #30 it turns into this step pattern later on, which makes tests very time-consuming. But during the first few hours I could watch the RSS literally grow by the minute while the dashboard was open. It should be pretty obvious whether you're affected by the same bug.
I will reboot tomorrow as I expect badblocks to have finished by then. Since this is a new install and I haven't done much with it I can leave it idle for a few days and see how it goes. Do you suggest I keep a browser window with the Dashboard going or not?@neofusion: Your workload could be interfering with the measurement. Maybe it's best if you wait for your jobs to conclude, reboot the system and then immediately keep a very close eye on the middlewared RSS. As shown in post #30 it turns into this step pattern later on, which makes tests very time-consuming. But during the first few hours I could watch the RSS literally grow by the minute while the dashboard was open. It should be pretty obvious whether you're affected by the same bug.
Here's a simple bash script for data logging. Save to
After rebooting you can then keep the dashboard open for 10 minutes, close it for 10 minutes, open it for 10 minutes, look at the data. Unless your system behaves differently from mine, it will be very obvious.
~/rsslog.sh and chmod +x. Set a cronjob to run it every minute and append the sample to a text file: * * * * * ~/rsslog.sh >> ~/rsslog.txtCode:
#!/bin/bash
printf '%(%H:%M)T '
ps x --sort -rss -o rss,command |grep middlewared |head -n1 |cut -d " " -f1
I will try that script.
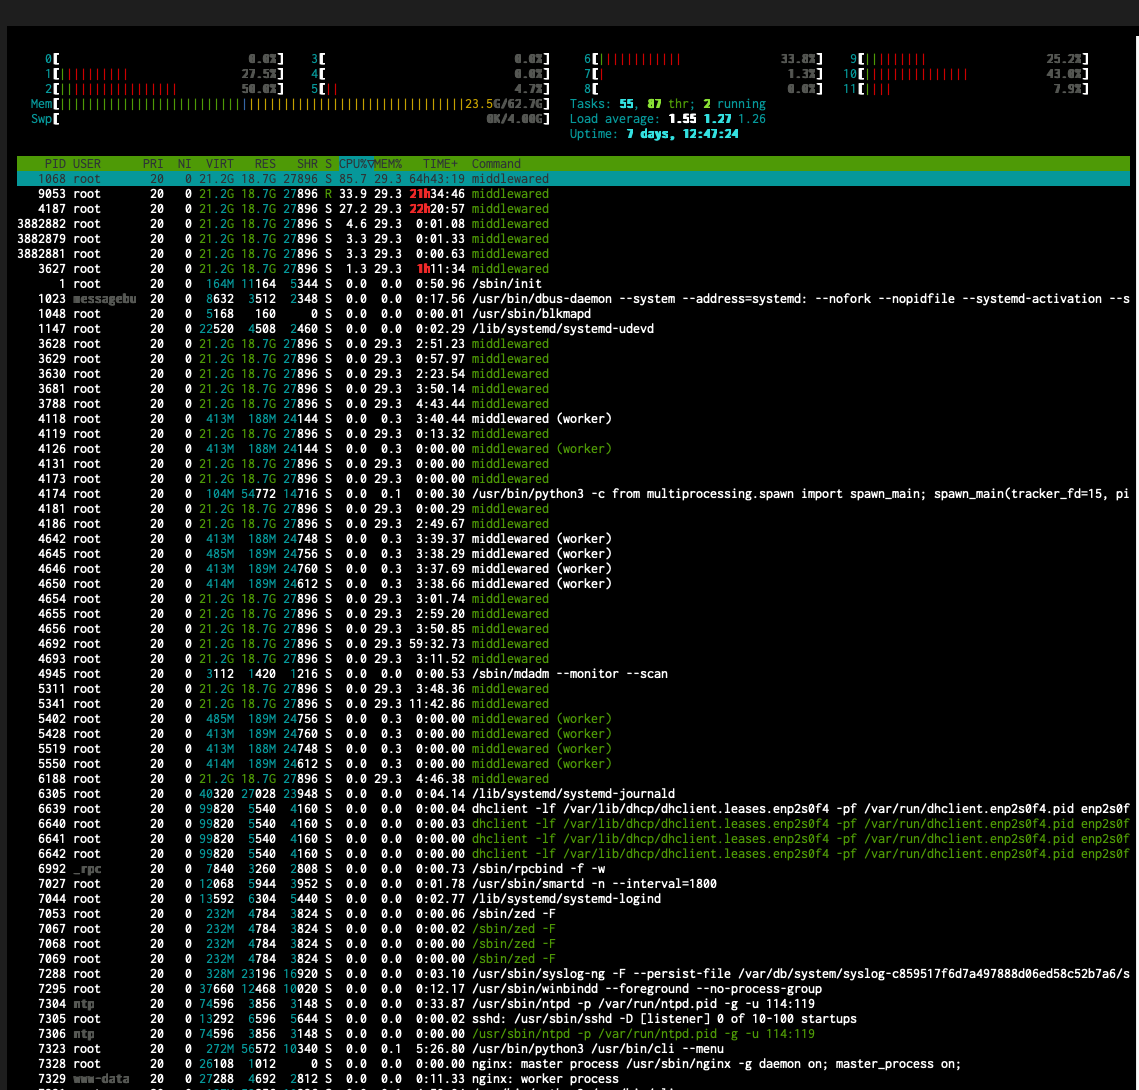
Meanwhile I rebooted earlier today and took these last two screenshots of htop and the Dashboard.
This was after badblocks had finished and the tmux sessions had been killed. The system was presumably idle.
I think 12-14% overall CPU usage and ballooned RAM usage is worrying. Something is stuck in a loop in a bad way.
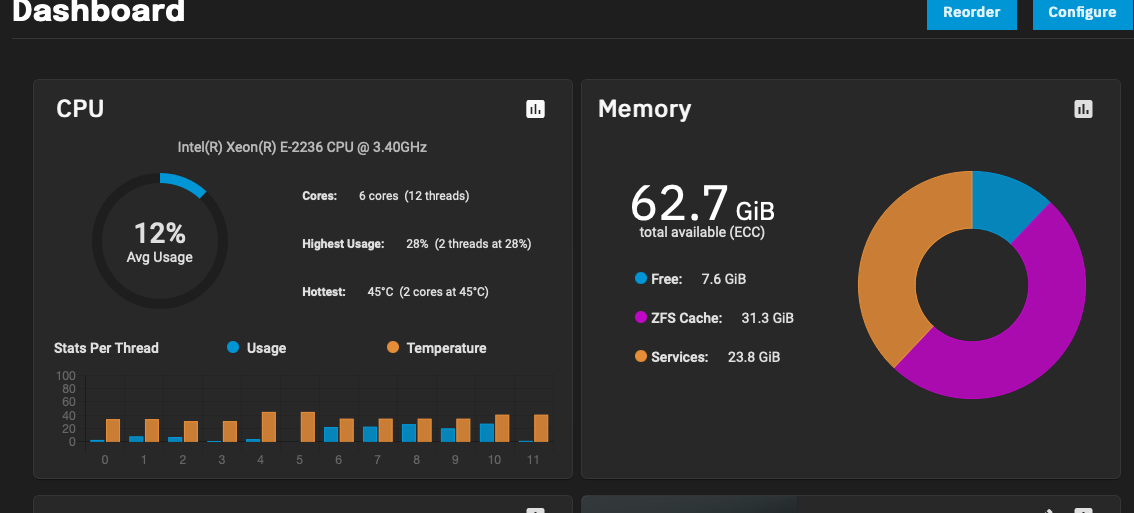
As a comparison, here's what the Dashboard look likes after a reboot:
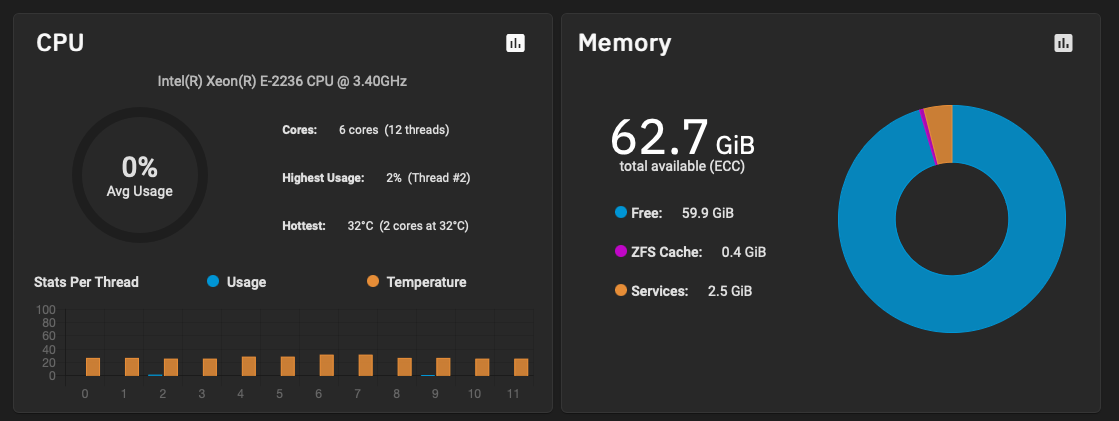
Again, this system is a new install roughly 2-3 weeks old, has never had apps or VMs setup and at most had smb and ssh services enabled with mild use at best.
Idle at 0-2% CPU usage is okay.
"Idle" at 12-14% CPU after 8 days is not.
Meanwhile I rebooted earlier today and took these last two screenshots of htop and the Dashboard.
This was after badblocks had finished and the tmux sessions had been killed. The system was presumably idle.
I think 12-14% overall CPU usage and ballooned RAM usage is worrying. Something is stuck in a loop in a bad way.
As a comparison, here's what the Dashboard look likes after a reboot:
Again, this system is a new install roughly 2-3 weeks old, has never had apps or VMs setup and at most had smb and ssh services enabled with mild use at best.
Idle at 0-2% CPU usage is okay.
"Idle" at 12-14% CPU after 8 days is not.
I added a calculated the delta for each ~30 minute time block, se result below.Here's a simple bash script for data logging. Save to~/rsslog.shandchmod +x. Set a cronjob to run it every minute and append the sample to a text file:* * * * * ~/rsslog.sh >> ~/rsslog.txt
After rebooting you can then keep the dashboard open for 10 minutes, close it for 10 minutes, open it for 10 minutes, look at the data. Unless your system behaves differently from mine, it will be very obvious.Code:#!/bin/bash printf '%(%H:%M)T ' ps x --sort -rss -o rss,command |grep middlewared |head -n1 |cut -d " " -f1
When the TrueNAS browser UI was opened it was sitting at the Dashboard.
Code:
21:17 303676 - opened browser window
21:18 303680
21:19 303444
21:20 304312
21:21 304312
21:22 307876
21:23 307876
21:24 309380
21:25 311524
21:26 311532
21:27 316816
21:28 316828
21:29 321124
21:30 321140
21:31 321144
21:32 322892
21:33 322928
21:34 325316
21:35 325324
21:36 327396
21:37 327424
21:38 328824
21:39 331484
21:40 335788
21:41 336928
21:42 338736
21:43 341144
21:44 341176
21:45 344080
21:46 344088 - closed browser window - past ~30 minute delta 40412
21:47 346268
21:48 346268
21:49 349484
21:50 349512
21:51 351664
21:52 351672
21:53 356872
21:54 361008
21:55 363708
21:56 368600
21:57 368600
21:58 371324
21:59 371684
22:00 371684
22:01 375236
22:02 375236
22:03 378276
22:04 378636
22:05 378636
22:06 381752
22:07 381752
22:08 381764
22:09 388080
22:10 388084
22:11 388212
22:12 389192
22:13 389192
22:14 392376
22:15 394624
22:16 397392
22:17 403772
22:18 403800 - opened browser window - past ~30 minute delta 59712
22:19 410164
22:20 418252
22:21 426740
22:22 432444
22:23 433460
22:24 434992
22:25 434996
22:26 434984
22:27 441316
22:28 447168
22:29 447772
22:30 447844
22:31 449596
22:32 455420
22:33 471976
22:34 473800
22:35 484752
22:36 486280
22:37 491584
22:38 498724
22:39 501152
22:40 504792
22:41 504884
22:42 509396
22:43 509404
22:44 510448
22:45 513428
22:46 523868
22:47 524788 - closed browser window - past ~30 minute delta 120988
22:48 524808
22:49 530260
22:50 530260
22:51 531560
22:52 534348
22:53 539364
22:54 539408
22:55 540524
22:56 543368
22:57 551220
22:58 551284
22:59 551284
23:00 551332
23:01 557256
23:02 558104
23:03 558104
23:04 558108
23:05 558108
23:06 563660
23:07 563660
23:08 563660
23:09 563664
23:10 569092
23:11 569092
23:12 569092
23:13 569092
23:14 573320
23:15 574908
23:16 574972
23:17 574972 - opened browser window - past ~30 minute delta 50184
23:18 579248
23:19 580752
23:20 586260
23:21 596660
23:22 596660
23:23 598628
23:24 602484
23:25 607668
23:26 623320
23:27 623692
23:28 631672
23:29 631968
23:30 637132
23:31 637108
23:32 637136
23:33 644900
23:34 644960
23:35 651224
23:36 651248
23:37 651272
23:38 658308
23:39 658312
23:40 658652
23:41 674224
23:42 678388
23:43 684120
23:44 684960
23:45 684960
23:46 697824
23:47 697832 - end of measurement - past ~30 minute delta 122860
MountainMan
Dabbler
- Joined
- Dec 10, 2020
- Messages
- 42
As far as that dashboard page goes, there are actually two different states to consider. When you bring up the dashboard, the browser subscribes to real-time stats data over the WebSocket (regardless of which widgets you have added.) If you browse to another page then there is communication to stop that data subscription. If you close the browser there is no communication to stop that data subscription. However, there is a background ping happening over the WebSocket that will no longer get a response, so presumably that's used to cleanup unreachable/closed connections.
Just mentioning this as it seems (again a guess) like sometimes the background middleware activity isn't stopped, as RAM continues to grow, and sometimes middlewared CPU use steps up over time as well -- for me.
Just mentioning this as it seems (again a guess) like sometimes the background middleware activity isn't stopped, as RAM continues to grow, and sometimes middlewared CPU use steps up over time as well -- for me.
Let's take a step back. Do we confuse multiple issues in this thread?
@Whiskydrinker's latest Jira commentary suggests that they may indeed be affected by a bug that's unrelated to the websocket issue we've been discussing. I didn't quite realize until now. (Sorry for hijacking your thread.)
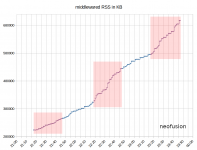
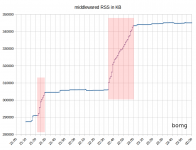
@neofusion, your middlewared memory usage doesn't display the same day-and-night difference as mine, although it does look like the dashboard has an effect. You could be affected by both Whiskydrinker's bug and the websocket thing, or there is some kind of underlying issue with varying manifestations.
Here are plots of neofusion's and my own middlewared's RSS growth. Open dashboard highlighted in red.


Let's take a step back. Do we confuse multiple issues in this thread?
Yes.
Literally just created an account to respond to this as I've experienced the issue and have had to repeatedly reboot a truenas box every week or so. Rather than essentially hijacking a thread with observations regarding interactive use (when there are two pages discussing this where people are leaving the system unattended much of the time) better to call these out separately.
There are likely many such issues to be discovered as Truenas SCALE evolves and stabilizes.
There is definitely a pattern of memory consumption due to middlewared and processing of application catalogs, which happen irrespective of dashboard use (dashboard use may accelerate this due to interactive queries but it is not solely because of). Truecharts makes this more evident.
We will see if the apparent unrelated fixes to some other memory issue (the jira ticket has been closed as a duplicate now, potentially due to the dashboard discussion) solve this. But I think if there have been no updates or changes to the underlying services of middlewared and any new clean up of apps, this is going to continue in the next update.
We will see if the apparent unrelated fixes to some other memory issue (the jira ticket has been closed as a duplicate now, potentially due to the dashboard discussion) solve this. But I think if there have been no updates or changes to the underlying services of middlewared and any new clean up of apps, this is going to continue in the next update.
There where changes in the middlewared regarding catalog syncing. Nightlies includes those, which I am using. Currently middlewared sits on 350-400mb usage (based on htop). It does not seem to increase over time. eg after 4 days uptime stayed the same.
Sure it does go up when syncing catalogs, but goes back down right after.
I have no idea if those changes is/will be included in the next update (which should land today? based on iX's posted schedule).
Last I saw they were expecting to release 22.02.2 within a week or two, we'll know very soon.There where changes in the middlewared regarding catalog syncing. Nightlies includes those, which I am using. Currently middlewared sits on 350-400mb usage (based on htop). It does not seem to increase over time. eg after 4 days uptime stayed the same.
Sure it does go up when syncing catalogs, but goes back down right after.
I have no idea if those changes is/will be included in the next update (which should land today? based on iX's posted schedule).
ClassicGOD
Contributor
- Joined
- Jul 28, 2011
- Messages
- 145
It's out now according to my dashboard.Last I saw they were expecting to release 22.02.2 within a week or two, we'll know very soon.
MountainMan
Dabbler
- Joined
- Dec 10, 2020
- Messages
- 42
I updated and so far middleware RAM use seems more well behaved, but time will tell. First boot after the update was a little rough as some middleware service for the network interface stats failed for some reason -- so the dashboard network widget just showed error icons. A second reboot cleared it.
Reboots (for me at least) are verrrrrrrrrry long though, because of the rebuilding of all the encrypted RAID1 swap partitions it makes. I really hope that gets sorted in the next release, as it can literally take over 10 mins to get through that on my build.
Reboots (for me at least) are verrrrrrrrrry long though, because of the rebuilding of all the encrypted RAID1 swap partitions it makes. I really hope that gets sorted in the next release, as it can literally take over 10 mins to get through that on my build.
Jump on their Jira and raise a ticket ;) This will make sure it will be seen from the right eyes!Reboots (for me at least) are verrrrrrrrrry long though, because of the rebuilding of all the encrypted RAID1 swap partitions it makes. I really hope that gets sorted in the next release, as it can literally take over 10 mins to get through that on my build.
MountainMan
Dabbler
- Joined
- Dec 10, 2020
- Messages
- 42
Thanks, I already have one posted for it, but it was too late for anything to hit this release. But if you'd like to help give it a push :) https://jira.ixsystems.com/projects/NAS/issues/NAS-116662
Whiskydrinker
Dabbler
- Joined
- Mar 15, 2022
- Messages
- 17
I've upgraded my installation yesterday, too. So far the memory consumption of the Services category in the memory dashboard seems stable and fine.I updated and so far middleware RAM use seems more well behaved, but time will tell.
And I have Truecharts added again.
Likewise, so far the memory allocation seems far less aggressive, it will become evident after about a week of operation if memory is being consumed/ released more than just consumed.I've upgraded my installation yesterday, too. So far the memory consumption of the Services category in the memory dashboard seems stable and fine.
And I have Truecharts added again.
MountainMan
Dabbler
- Joined
- Dec 10, 2020
- Messages
- 42
So after about a week of use here, I feel like those two patches got rid of the most obvious memory leaks. However, I still see runaway CPU and memory that seems to be related to the dashboard page its stats data streamed via websocket.
After CPU climbed considerably on me last week I made a script to log CPU and RSS memory use for middlewared. Once added to cron, I gave the system a fresh reboot and didn't touch the UI for several days -- during that time middleware CPU and memory where very well behaved. Then this morning I logged in and left the dashboard page up for a couple hours, watching cpu and memory slowly climb. I then closed the page (exiting the browser) and middleware cpu and memory didn't reset, but rather they continue to climb even now -- triggered by that browser session this morning.
Anyway, I filed a bug here if anyone else is seeing the same behavior: https://jira.ixsystems.com/projects/NAS/issues/NAS-116953
Important Announcement for the TrueNAS Community.
The TrueNAS Community has now been moved. This forum will now become READ-ONLY for historical purposes. Please feel free to join us on the new TrueNAS Community Forums.Related topics on forums.truenas.com for thread: "Middlewared having a memory leak in 22.02.0?"
Similar threads
- Replies
- 7
- Views
- 4K
- Replies
- 2
- Views
- 2K
- Replies
- 7
- Views
- 4K
