Middlewared having a memory leak in 22.02.0?

Whiskydrinker

Dabbler
Joined
Mar 15, 2022
Messages
17
Since I was getting closer to an out of memory situation again on Sunday I decided to try something. I removed the Truecharts catalog and rebooted. Interestingly the memory consumption of the services category in the dashbord chart seems to grow much slower this way.

Guess I'll wait for the first real upate if that changes something. Otherwise I'll do some more tests how much the middleware grows within 24 hours with only the official catalog and with an added Truecharts for filing a ticket.
 

stuible

Cadet
Joined
Oct 18, 2019
Messages
6
I am also experiencing this issue. I have to kill asyncio_loop every few days or else it uses almost all of my 16GB of memory and my NAS hangs. Updating TrueCharts apps appears to make the memory leak grow worse but I haven't confirmed that yet.
 

Sveken

Cadet
Joined
May 3, 2022
Messages
7
Just posting here, 41 day uptime and asyncio_loop is using 23GB of our 64GB RAM
We have the truecharts catalog added but otherwise its sitting idle not running any apps
 

anyuser

Dabbler
Joined
Apr 7, 2022
Messages
11
Another datapoint. 24 days uptime and services memory has been stable at 3GB. No app catalogs loaded - either official or Truecharts (App pool unset)
 

BoomShaka

Dabbler
Joined
Feb 17, 2022
Messages
17
I'd like to bump this since I'm having what appears to be the same issue. With the NetData app I observed more and more memory being grabbed overtime by "other" processes. However when I did more digging these plots lined up with the "systemctl Services" memory plot that shows middlewared consuming more and more until each reboot. I am also using Truecharts. I am not sure whether this is directly linked to Truecharts though or if this would happen with any large catalog, or whether its purely coincidence.
 

MountainMan

Dabbler
Joined
Dec 10, 2020
Messages
42
You're not alone, and from what I've seen on the forums and Discord, the common factor does seem to be processing the Truecharts catalog over time. I saw my services memory grow to 28G in about a week with only two apps running which were consuming well under 1G. With 22.02.1 I've also seen background CPU creep up with memory, which a reboot cleaned up. I'm just waiting to see if that re-appears as well. Hopefully it gets sorted out, as other than that things have been working great for me. :)
 

LarsR

Guru
Joined
Oct 23, 2020
Messages
714
I've read in another forum post, that it's not directly the fault of the truecharts catalogue, but rather the way truenas chaches the catalogue data.
It affects truecharts more then the official apps, because truecharts has a lot more apps and therefore way more data to cache. If my memory is correct truenas keeps the old apps data and adds the new one with every catalogue refresh. And for 160+ apps that could result in a few gb every catalogue sync.
 

bomg

Dabbler
Joined
May 10, 2022
Messages
10
I'm experiencing the same problem since I upgraded from RC2 to 22.02.1 last week. The asyncio_loop process is claiming progressively more memory at a rate of about 2G per day. It doesn't happen in noticeable steps but very gradually. The issue doesn't appear related to containers, though, because I don't use any: No images or catalogs were added on my system, not even a pool is set.
 

bomg

Dabbler
Joined
May 10, 2022
Messages
10
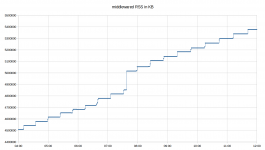
I took some samples overnight. The RSS of the delinquent process grew from ~4.5GB to ~5.4GB over a period of 8 hours. There is a visible step pattern with a slightly irregular interval of 25-30 minutes.

Anyone have a clue what TrueNAS might be doing here? It doesn't update the default app catalog that often and somewhat randomly, or does it?

middlewared.png
 

Whiskydrinker

Dabbler
Joined
Mar 15, 2022
Messages
17
I am not sure whether this is directly linked to Truecharts though or if this would happen with any large catalog, or whether its purely coincidence.
It's the size of the catalog that makes the difference. When you only have the "Official" catalouge for apps the memory consumption also grows but at a much much slower pace.

Has anyone opened a bug report on Jira yet does anyone know?
I have since I could also see the memory consumption still grow after upgrading to 22.02.1


MountainMan

Dabbler
Joined
Dec 10, 2020
Messages
42
Prior to 22.02.1 I saw service memory grow, but what seems to be new (for me) in 22.01.1 is increased cpu/load, both when idle (after fresh start), and after some middleware event -- which starts its load slowly rising. I just removed the TrueCharts catalog (since I wasn't use any of the apps yet) and rebooted to see how things change.

load-quasar.png
 

bomg

Dabbler
Joined
May 10, 2022
Messages
10
It's the size of the catalog that makes the difference. When you only have the "Official" catalouge for apps the memory consumption also grows but at a much much slower pace.
I only have the official catalog set up and my memory consumption grows significantly faster than yours did when you had Truecharts added on top. The evidence gathered in this thread does not support such a strong conclusion yet.

Another data point: Looking for a workaround I set the "Network -> Global Configuration -> Outbound Network" option to "Deny All", which should block any attempt to update the app catalog. There was no effect and middlewared is still hogging additional memory at the same rate.
 

bomg

Dabbler
Joined
May 10, 2022
Messages
10
Over the past couple days I've continued to record the middlewared (asyncio_loop) memory usage and noticed this: Memory usage is only increasing while a browser window with the TrueNAS web interface is open. Close the browser window and memory usage becomes static.

Can someone else replicate the experiment for confirmation?

First, log your current middlewared memory usage. The middlewared process with the largest RSS is probably the one you're looking for, unless you rebooted very recently.

ps x --sort -rss -o rss,command |grep middlewared |head -n1

Note the value and repeat the measurement after a few hours have passed (a) while the web UI was active, and (b) while no web UI was active.

Update: Only doing short-term tests right now, but with the "storage" UI page open in a browser the mem bloat appears to stop, too. The culprit might be one of the dashboard widgets. Checking those next.
 
Last edited:

MountainMan

Dabbler
Joined
Dec 10, 2020
Messages
42
I think you're on to something. On my install I definitely see middleware RAM use increase when the dashboard is active, which doesn't seem to ever be reclaimed.

Regarding the widgets and browsing to other pages. I removed all the widgets from the dashboard, and could still see middleware RAM increasing. After poking further, even with no widgets active, the WebSocket still delivers all the real-time stats data that the widgets would display. (data below is with no widgets active). So if the background real-time data gathering is involved, it won't be isolated to any specific widget.

Also when you browse away from the dashboard, a message is sent over the WebSocket to stop that real-time data stream. So to me that seems like a potential suspect. I've definitely had the dashboard up a lot while loading this new server up.

websocket-rt-stop.png


websocket-rt-stats.png


Edit: In thinking about this more, it seems it could just be related to WebSocket data in general. Just that when you're on the dashboard page considerably more data is sent due to the real-time statistics messages.
 
Last edited:

neofusion

Contributor
Joined
Apr 2, 2022
Messages
159
Edit: In thinking about this more, it seems it could just be related to WebSocket data in general. Just that when you're on the dashboard page considerably more data is sent due to the real-time statistics messages.
So there's reason to think the same thing would happen if you leave htop running in a shell in the browser?

After 6 days of running badblocks on my new drives I have witnessed a sizeable chunk of the memory gobbled up by middlewared.
No VM or apps installed, nor has a pool been selected for the apps. Running TrueNAS-SCALE-22.02.1.

Smb has been on and off, seeing relatively little activity overall.
During evenings I've had a browser window opened idling on the Dashboard.

htop.png

ram_use.png
 

MountainMan

Dabbler
Joined
Dec 10, 2020
Messages
42
I don't see how htop itself could be directly involved, but the "Web shell" in the UI does make use of another (separate) WebSocket to stream its data. So perhaps that could add to the total? All just guesswork at this point, but I'm curious to try a fresh reboot and not touch the UI for a few days. :). Only problem is, my Plex doesn't seem to startup automatically about 90% of the time. :/
 

MountainMan

Dabbler
Joined
Dec 10, 2020
Messages
42

neofusion

Contributor
Joined
Apr 2, 2022
Messages
159
I don't see how htop itself could be directly involved, but the "Web shell" in the UI does make use of another (separate) WebSocket to stream its data. So perhaps that could add to the total? All just guesswork at this point, but I'm curious to try a fresh reboot and not touch the UI for a few days. :). Only problem is, my Plex doesn't seem to startup automatically about 90% of the time. :/
That was actually exactly my point. htop is unlikely to be responsible for the apparent leak but since htop is constantly creating a need to update the page it ensures WebSocket has to rerender the window.

Has anyone actually created a ticket for this issue yet?

Thanks,
Harry
Yes, right here:
It's the size of the catalog that makes the difference. When you only have the "Official" catalouge for apps the memory consumption also grows but at a much much slower pace.


I have since I could also see the memory consumption still grow after upgrading to 22.02.1

 
Last edited:
Top