Lost ability to select and rearrange system tiles in TC 1.3.1 + replication from go to whoa

Joined
Jan 4, 2014
Messages
1,644
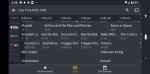
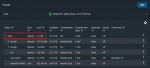
In TC 1.3.1, it's possible to select all systems or just one system for viewing, but it doesn't appear to be possible to select anything in between.

screenshot.452.png


Why might that be useful? Consider the following video Replication under TC 1.3.1, which shows replication happening between two systems - from freenas-l2 to freenas-t. The other system tiles are not of interest, but I don't appear to be able to switch them off so I can just focus on the two systems in question. There also doesn't appear to be a way of rearranging the tiles - tiles are organised in alphabetical order. Unless I'm missing something, say in a 20 server environment, under TC 1.3.1, it would not be possible to easily observe the interaction between the first and twentieth systems.

While the system tiles were no way close to being as dynamic and visually informative under TC 1.2.3, this video Rearranging system tiles under TC 1.2.3 demonstrates how you could select tiles of interest and rearrange their order (not drag and drop, a bit clumsy, but doable).
 
Last edited:
Joined
Jan 4, 2014
Messages
1,644
Something else I picked up on...throughout the replication, the progress indicator never goes up from 0%. A bug somewhere maybe?

screenshot.453.png
 
Last edited:
Joined
Jan 4, 2014
Messages
1,644
Interesting to see what's happening on the source and target systems during replication.

SOURCE
TARGET


I wasn't expecting CPU to be a flat line though?
 
Joined
Jan 4, 2014
Messages
1,644
There's about 3.14 TiB of data on the source system that's being replicated.

screenshot.456.png


At this point in time, the target system has received around 2.49 TiB of that data.

screenshot.457.png


The system tile for the target system shows 3.44 TB as being used.

screenshot.458.png


I'm assuming the difference is 'working space'? Btw, there's a mixed use of units here - TiB and TB. Is it possible to normalise?
 

morganL

Captain Morgan
Administrator
Moderator
iXsystems
Joined
Mar 10, 2018
Messages
2,691

morganL

Captain Morgan
Administrator
Moderator
iXsystems
Joined
Mar 10, 2018
Messages
2,691
There's about 3.14 TiB of data on the source system that's being replicated.

View attachment 40833

At this point in time, the target system has received around 2.49 TiB of that data.

View attachment 40834

The system tile for the target system shows 3.44 TB as being used.

View attachment 40835

I'm assuming the difference is 'working space'? Btw, there's a mixed use of units here - TiB and TB. Is it possible to normalise?

Is it possible to normalize, yes, but it does cause problems. Disk drives work in TB (base 10). ZFS and OSes work in TiB (base 2). If you can convince the disk industry to change, we'd all get larger disks and have no problems. Unlike the baker's dozen which is 13, the disk drive dozen TB is 11 TiB.
 
Joined
Jan 4, 2014
Messages
1,644
On the question of showing multiple systems, the intent is that you can group/tag multiple systems and then show that group.
I did pick up on the group feature earlier while browsing the TC1.3.1 menus...

screenshot.459.png


... but it wasn't clear to me then how to select the group. I've just figured it out.

screenshot.460.png


I thought I might find it under the 'All systems' dropdown, but it's available through 'Find'. This isn't exactly intuitive, but then, this may have been documented, but as 1.3 documentation isn't yet available, I'm kinda groping in the dark a little.
 
Last edited:
Joined
Jan 4, 2014
Messages
1,644
Is it possible to normalize, yes, but it does cause problems. Disk drives work in TB (base 10). ZFS and OSes work in TiB (base 2). If you can convince the disk industry to change, we'd all get larger disks and have no problems. Unlike the baker's dozen which is 13, the disk drive dozen TB is 11 TiB.
Hah, that's a good analogy. Maybe, IXsystems could normalise using a new unit call the TuB, which is the average of TB and the TiB :wink:
 
Joined
Jan 4, 2014
Messages
1,644
Joined
Jan 4, 2014
Messages
1,644
Well, the replication has completed, and I've noticed storage figures still don't match between FreeNAS and TC 1.3.1. Between FreeNAS servers, the numbers are fine... 3.14 TiB has transferred between the source and target systems (yellow highlighted boxes in the images below).

Source: freenas-l2
SOURCE


Target: freenas-t
TARGET


However, there doesn't appear to be a correlation between total storage used (red highlighted boxes above) and what TC 1.3.1 is suggesting below.

screenshot.461.png


Source: 3.16 TB = 2.87 TiB ≠ 3.3 TiB
Target: 4.32 TB = 3.93 TiB ≠ 3.14 TiB

Thoughts?
 

Attachments

  • Screenshot_20200116-160828.png
    Screenshot_20200116-160828.png
    493.5 KB · Views: 306
  • screenshot.462.png
    screenshot.462.png
    49.7 KB · Views: 295
  • Screenshot_20200116-160828.png
    Screenshot_20200116-160828.png
    493.5 KB · Views: 298
Last edited:
Joined
Jan 4, 2014
Messages
1,644
The replication exercise from start to finish, from the perspective of TC 1.3.1 has, I think, been useful. The replication completed successfully, but it's thrown up a few juicy surprises for TC along the way. I've summarised this in the table below. Hopefully, it's a source of useful feedback for the TC development team.

ObservationPostsNotes
Selective viewing of system tiles in TC 1.3.1#1, #5, #7Not intuitive. Lack of documentation.
Replication progress stays at 0%#2, #5, #9Bug reported TC-1493
Unexpected CPU flatline#3
Storage figures don't add up#4, #10
 
Last edited:

morganL

Captain Morgan
Administrator
Moderator
iXsystems
Joined
Mar 10, 2018
Messages
2,691
I thought I might find it under the 'All systems' dropdown, but it's available through 'Find'. This isn't exactly intuitive, but then, this may have been documented, but as 1.3 documentation isn't yet available, I'm kinda groping in the dark a little.

TrueCommand 1.3 documentation is in the process of being shifted to the new TrueNAS documentation site. https://www.truenas.com/docs/hub/truecommand/
The advantage is it easier for users to contribute.

The "storage used" number can be different because of snapshots and other storage overheads.
 

aervin

iXsystems
iXsystems
Joined
Jun 13, 2018
Messages
114
We should refine the dash system dropdown to be a multi-select with system groups included in the list, probably at the top. I think this will allow @Basil Hendroff and others to hone in on the systems they want to monitor. Systems related by replication are obvious candidates for a system group. We'll target this for the next minor 1.3 patch.

@Basil Hendroff Something of note: TC uses a 3-minute polling interval for progress stats like replication status %complete. This interval is not yet configurable. We're trying to keep our footprint on the NAS as light as possible. Why the progress is always 0%, I'll need to investigate.

Those are suspicious CPU stats during replication. I'll ask around about that.
 
Joined
Jan 4, 2014
Messages
1,644
We're trying to keep our footprint on the NAS as light as possible.
That makes complete sense. I'm not sure that it's necessary to make this configurable, but if the decision is made to do so, can I suggest that a range of acceptable values is allowed - too low and the footprint is too large; too high and the near-real-time visual feedback is lost.
 
Joined
Jan 4, 2014
Messages
1,644
screenshot.474.png


This view shows that I've got near complete saturation of the network i/f and CPU of a replication target freenas-b2. There are two replication sources freenas-l and freenas-l2 that are hammering the target. This is not a usual situation, but a demonstration of the value of the visual feedback that the TC dashboard provides. This is just for passing interest. It isn't the primary reason for this post.

The tiles in the above image are ordered alphabetically. It would be preferable if I had control over the order of the tiles at least for system groups. Now, in its relative infancy, I'm not expecting drag-and-drop from TC (well not yet anyway :wink:), so how might this be established?

Note for the search bar in the image above, I've set up a system group, with a name that reflects the preferred order of tiles.

One way to honour this order might be to allow the preferred order to be set when the group is defined. Currently, the behaviour is such that it doesn't matter what order I add systems to a group, the systems are ordered alphabetically (although I thought 'l' would appear before 'l2' in the screenshot below?).

If I had control over the order of systems in the system group, then this could be used as a reference to establish the order of tiles on the dashboard. Thoughts?

screenshot.475.png
 
Joined
Jan 4, 2014
Messages
1,644
Right, now I'm getting some replication progress indication. However, the number is quite meaningless. For instance, in the image below, the suggestion is that replication of the apps dataset tree is 94% complete.

screenshot.478.png


Having a look at the source system, there's around about 583 GiB to transfer.

screenshot.479.png


On the target system, around 108 GiB has transferred across.

screenshot.481.png


... but that represents just 19% of what needs to come across. So where is the replication figure of 94% coming from?

Having a look at the running replication task on the source system:

screenshot.477.png


Clicking the orange RUNNING button reveals the source of the figure:

screenshot.476.png


Was this intended? If not, some other algorithm is required to calculate the replication progress.
 

morganL

Captain Morgan
Administrator
Moderator
iXsystems
Joined
Mar 10, 2018
Messages
2,691
Good observation. I think the issue is getting the right data from the system for each replication. Estimating replication time would be useful
 
Top