Gravwell SYSLOG Queries

NickF

Guru
Joined
Jun 12, 2014
Messages
763
Hi Everyone,

I am working in my work life with a company called Gravwell (Free for Home Use, https://www.gravwell.io/). I have no affiliation with them other than being a customer of theirs. I asked their help to create a "Kit" to pull things out of the logs and make meaningful dashboards, as I have alot of crummy servers running TrueNAS (and FreeNAS still lol) for video surveillance applications. This may be a great tool in conjunction with @joeschmuck's script. Am I missing anything critical here?

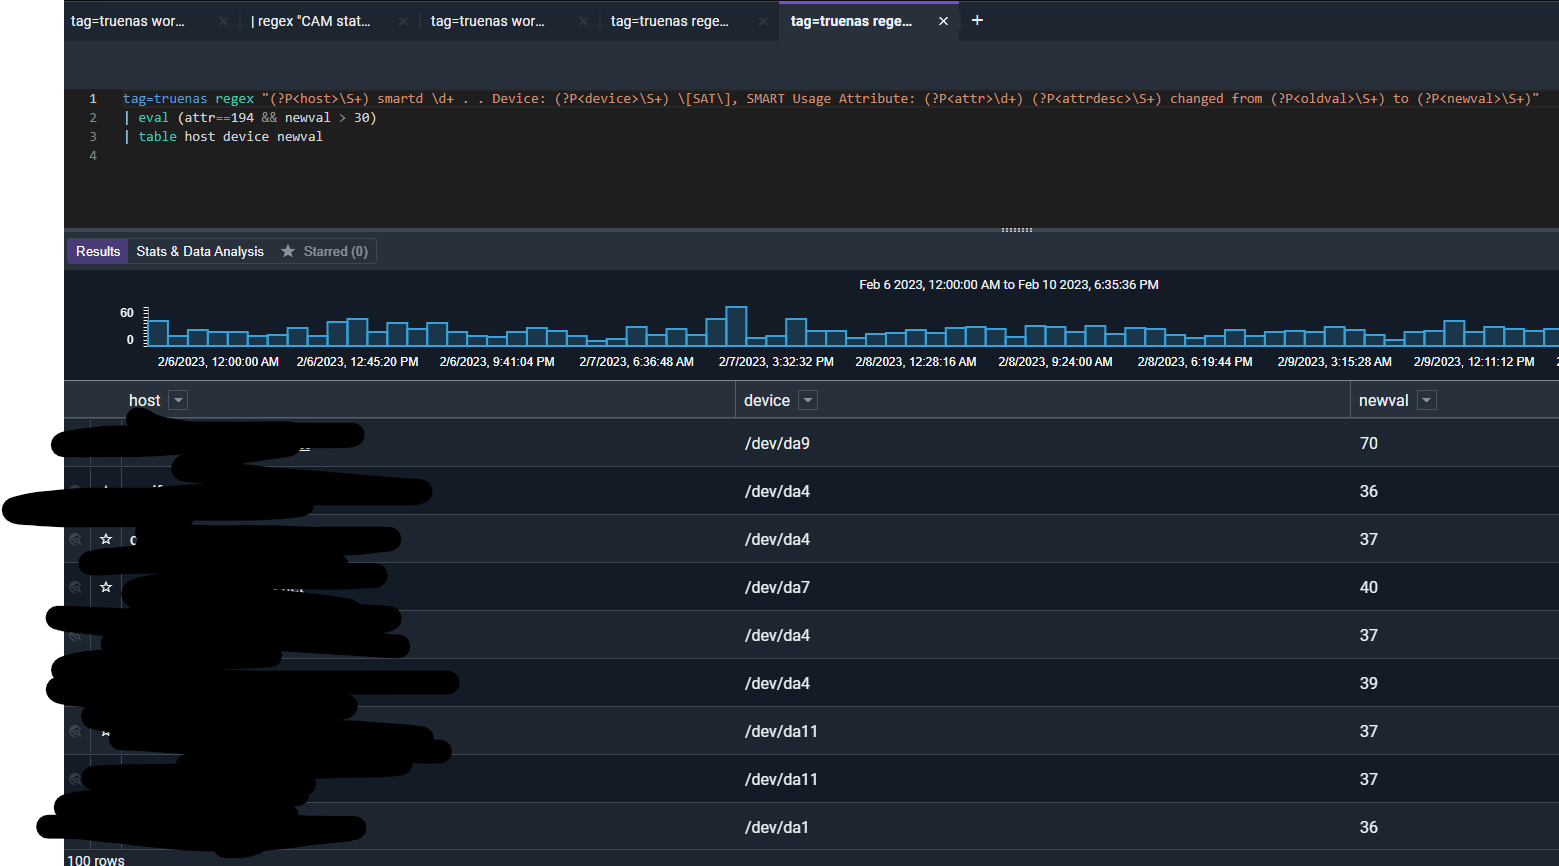
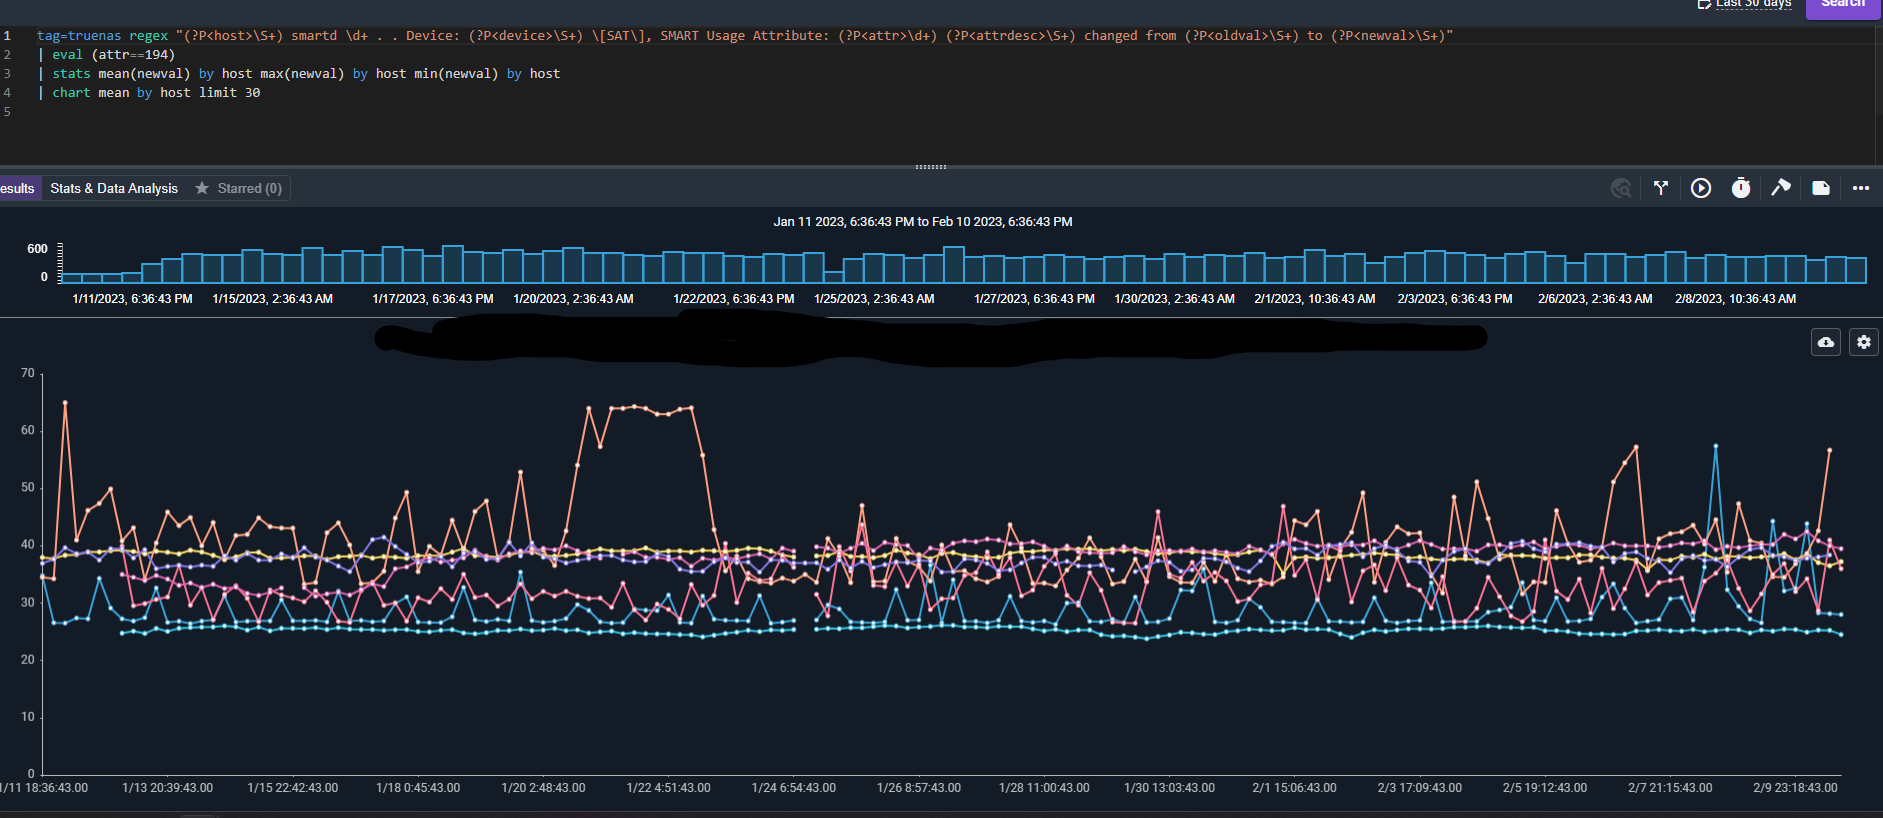
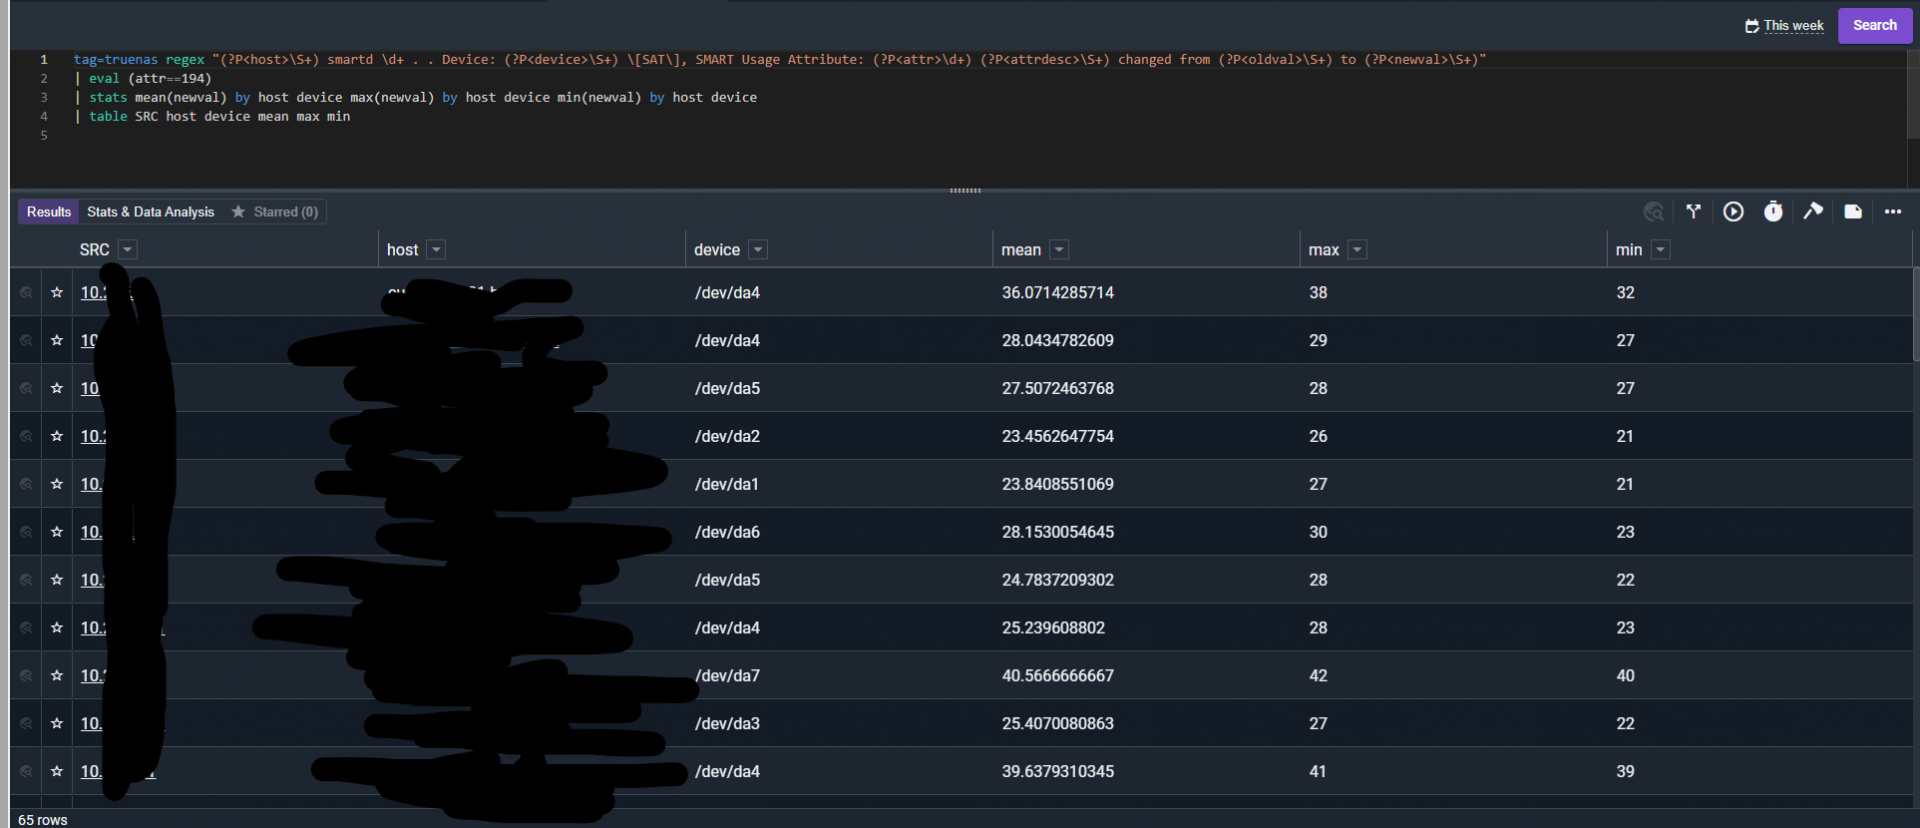
Some examples from my dataset:
1676072063828.png


1676072172934.png

1676072234322.png


1676074878485.png

1676074929891.png
 

joeschmuck

Old Man
Moderator
Joined
May 28, 2011
Messages
10,994
Nick,
One of the things I wanted to do but it's outside my wheelhouse was to create a dashboard or GUI that runs on TrueNAS and provides the data that the Multi-Report script provides and the adjustable alarm setpoints. I have not examined the TrueNAS logs so I'm not sure what else can be displayed. If I understand you correctly, the data provided above is sourced from the TrueNAS logs. I have to assume you have read the log data so I guess the question is, what data is relevant to you as the person maintaining a set of servers that is int eh log data and what are you missing?

As for the temperature data, the Multi-Report script also creates a CSV file of all the relevant data each time the script is run. You can also run the script just to collect statistical data (no email output) which is what I do, once an hour. This CSV can then be opened in a Spreadsheet application and the data can be examined, plotted, etc. Take a look at the first line of data, this contains the column titles. It works fine when doing some data analysis. But you could use this data to create a dashboard if you desire. I'm not sure if this helps you or not.

Cheers!
 

NickF

Guru
Joined
Jun 12, 2014
Messages
763
Nick,
One of the things I wanted to do but it's outside my wheelhouse was to create a dashboard or GUI that runs on TrueNAS and provides the data that the Multi-Report script provides and the adjustable alarm setpoints. I have not examined the TrueNAS logs so I'm not sure what else can be displayed. If I understand you correctly, the data provided above is sourced from the TrueNAS logs. I have to assume you have read the log data so I guess the question is, what data is relevant to you as the person maintaining a set of servers that is int eh log data and what are you missing?

As for the temperature data, the Multi-Report script also creates a CSV file of all the relevant data each time the script is run. You can also run the script just to collect statistical data (no email output) which is what I do, once an hour. This CSV can then be opened in a Spreadsheet application and the data can be examined, plotted, etc. Take a look at the first line of data, this contains the column titles. It works fine when doing some data analysis. But you could use this data to create a dashboard if you desire. I'm not sure if this helps you or not.

Cheers!
Hi Joe,

The logs, even by default, give us insight into things that you haven't been tracking historically.

Here's an example, this drive, according to SMART is fine from multireport:
1676082596005.png


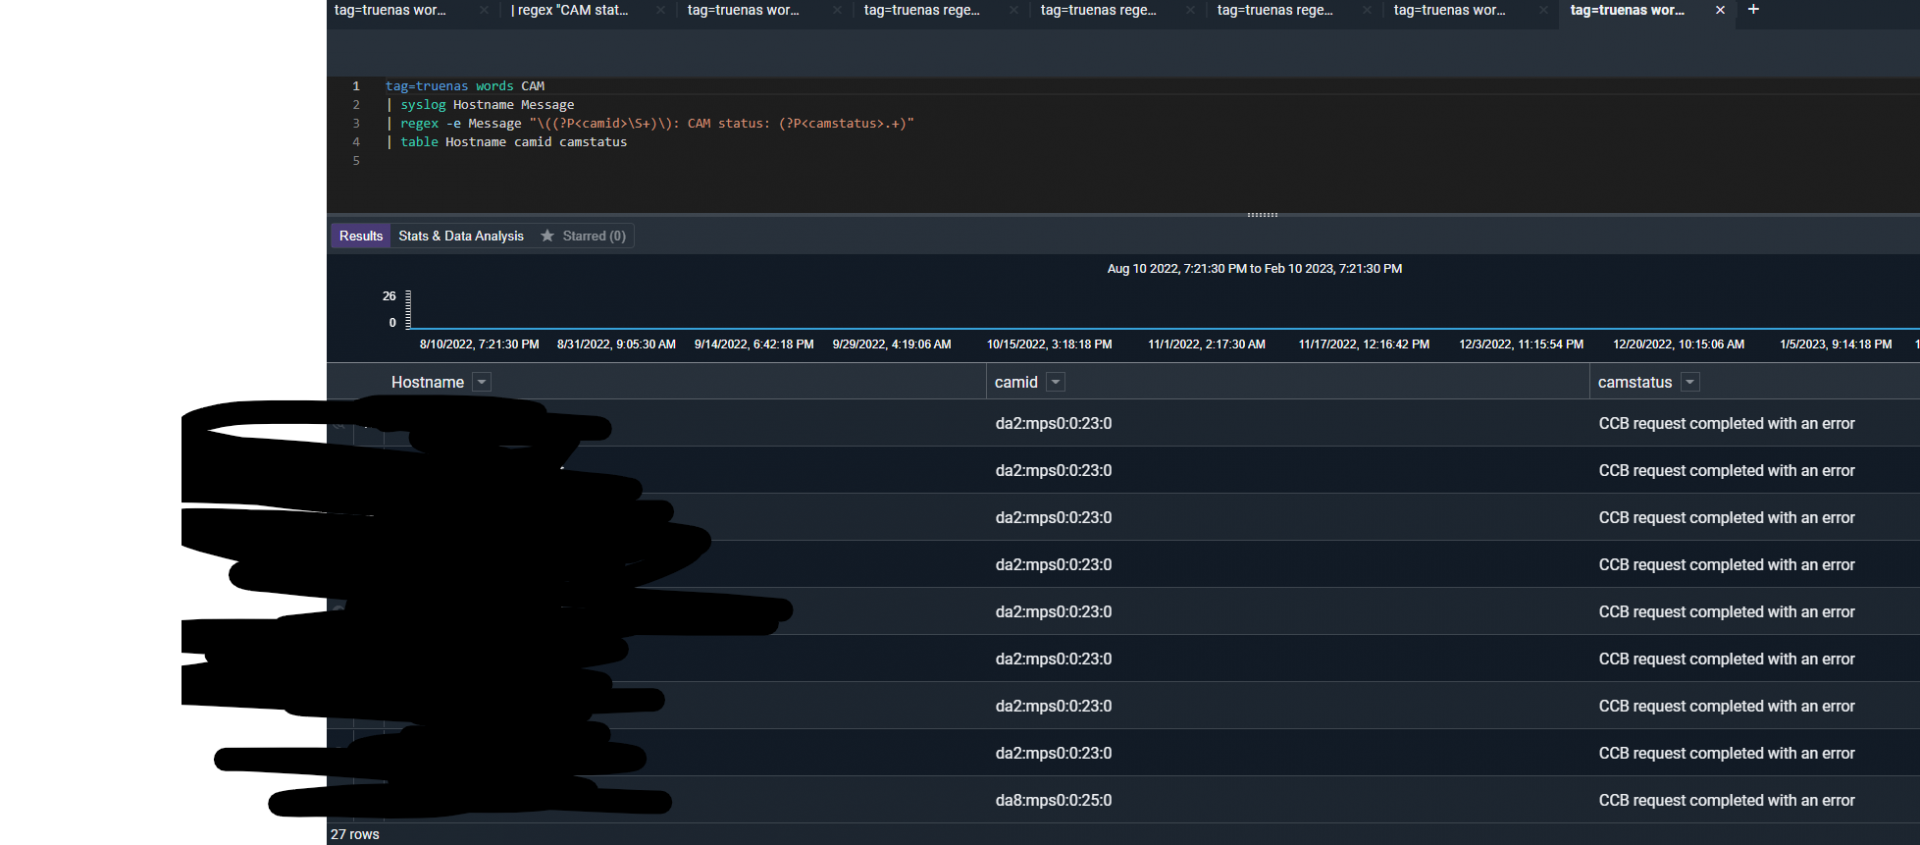
But that same drive spit out 27 CAM errors over the past 30 days, and may be failing.
1676082661987.png


Where as this other system (similar spec) shows everything is fine, and there have been no CAM errors.
1676082845006.png


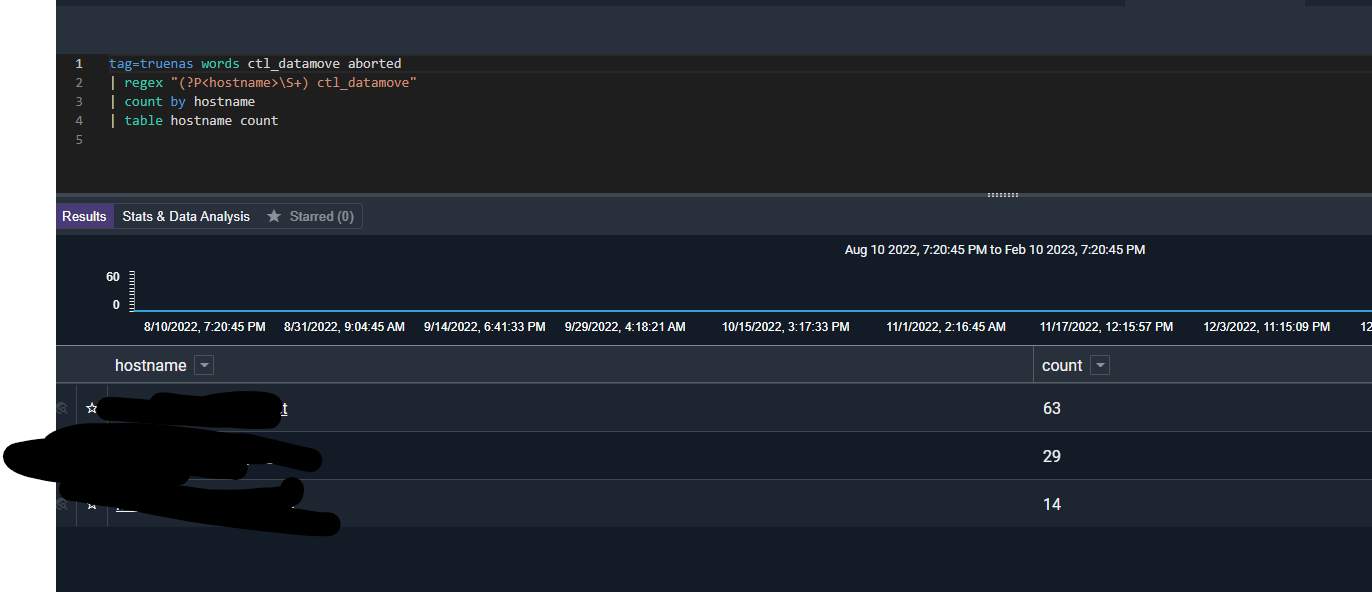
But I am getting several ctl_datamove aborted errors, which means that ISCSI is having a problem and their may be a networking issue or the backing zpool for that LUN is not able to keep up with the writes being committed.

1676082984803.png


I'm sure there are a whole bunch more useful things we can do with the logs, I have a pretty big dataset. But I'm just not sure what else to look for, other than those few examples and whatever data SMART is sending to Syslog (which is not everything, and not for every drive, I'm not sure what triggers SMART to send something to syslog).

Then I have this one, where you picked up 4 read errors in multireport, but all the drives show as healthy, I want to try and figure out in the logs how to catch this:
1676083303336.png


Just looking for feedback for some common errors that folks have run into. I like having the flexibility to visualize this type of data, and also compare it in conjunction with other data sources I have.
 

joeschmuck

Old Man
Moderator
Joined
May 28, 2011
Messages
10,994
But that same drive spit out 27 CAM errors over the past 30 days, and may be failing.
What is the error message just before the CAM errors? Read, Write, Abort, Reset, etc.

A CCB error does not automatically mean the hard drive is bad from what little I understand about CCB messages. But to be clear, I do not know much at all about CAM Control Bus errors. I do not use ISCSI so my experience is just what I look into and when I played with ISCSI about 9 years ago for a few months. But if this is a factor which it could be, then maybe it should be included in the Multi-Report script, eventually, after I understand more.

Then I have this one, where you picked up 4 read errors in multireport, but all the drives show as healthy
That is a function of zpool status, not anything fancy from me. I would expect TrueNAS to report an unhealthy pool.
 
Top