Azsumbre13
Dabbler
- Joined
- Jul 3, 2023
- Messages
- 31
Hi all I am new to the TrueNas community and configuration as a whole.
It may be a stupid question ,but can someone give some ideas on why would my CPU always run at 25 percent:
ast pid: 8237; load averages: 1.03, 0.98, 0.95; b up 0+05:10:12 13:40:48
92 processes: 1 running, 91 sleeping
CPU: 0.1% user, 0.0% nice, 0.0% system, 24.0% interrupt, 75.9% idle
Mem: 338M Active, 3370M Inact, 1310M Wired, 10G Free
ARC: 622M Total, 370M MFU, 219M MRU, 4887K Header, 23M Other
511M Compressed, 1055M Uncompressed, 2.06:1 Ratio
Swap: 2048M Total, 2048M Free
PID USERNAME THR PRI NICE SIZE RES STATE C TIME WCPU COMMAND
400 root 30 20 0 376M 267M kqread 3 0:45 0.15% python3.
4326 88 59 20 0 2330M 617M select 2 0:34 0.10% mysqld
8237 root 1 20 0 14M 4212K CPU3 3 0:00 0.03% top
3042 535 4 20 0 34M 9792K kqread 2 0:03 0.02% redis-se
3011 root 7 20 0 65M 33M select 2 0:02 0.01% python3.
1514 www 1 20 0 38M 10M kqread 1 0:00 0.00% nginx
1427 ntpd 1 20 0 21M 7144K select 2 0:00 0.00% ntpd
1456 root 8 20 0 52M 12M select 1 0:11 0.00% rrdcache
3046 root 1 20 0 616M 32M kqread 1 0:00 0.00% php-fpm
1383 root 1 -52 r0 13M 13M nanslp 2 0:00 0.00% watchdog
1523 root 11 20 0 114M 52M nanslp 2 0:23 0.00% collectd
I am running nextcloud on it ,but even before i configured and installed nexcloud i had the same issue.
I am running a baremetal:
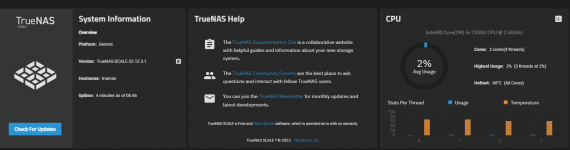
Intel(R) Core(TM) i5-7200U CPU @ 2.50GHz
16gb RAM
with TrueNas core
TrueNAS-13.0-U5.1
Here is also top -P:
last pid: 8288; load averages: 1.05, 1.01, 0.96; b up 0+05:13:56 13:44:32
92 processes: 1 running, 91 sleeping
CPU 0: 0.0% user, 0.0% nice, 0.0% system, 97.6% interrupt, 2.4% idle
CPU 1: 0.0% user, 0.0% nice, 0.0% system, 0.5% interrupt, 99.5% idle
CPU 2: 0.5% user, 0.0% nice, 0.0% system, 0.0% interrupt, 99.5% idle
CPU 3: 0.5% user, 0.0% nice, 0.0% system, 0.0% interrupt, 99.5% idle
Mem: 336M Active, 3376M Inact, 1310M Wired, 10G Free
ARC: 625M Total, 370M MFU, 223M MRU, 4882K Header, 23M Other
511M Compressed, 1055M Uncompressed, 2.06:1 Ratio
Swap: 2048M Total, 2048M Free
PID USERNAME THR PRI NICE SIZE RES STATE C TIME WCPU COMMAND
8288 root 1 21 0 14M 4208K CPU3 3 0:00 0.12% top
4326 88 59 20 0 2330M 617M select 3 0:34 0.11% mysqld
400 root 30 21 0 378M 268M kqread 3 0:46 0.06% python3.
3042 535 4 20 0 34M 9792K kqread 2 0:03 0.02% redis-se
3011 root 7 20 0 65M 33M select 2 0:03 0.02% python3.
1514 www 1 20 0 38M 10M kqread 2 0:00 0.00% nginx
1427 ntpd 1 20 0 21M 7144K select 1 0:00 0.00% ntpd
1456 root 8 20 0 52M 12M select 3 0:11 0.00% rrdcache
3046 root 1 20 0 616M 32M kqread 2 0:00 0.00% php-fpm
The only test I have done is upgrade the BIOS to the latest and test with windows 11 as a operating system if the CPU will get such interupts also.
Windows 11 was running at 1 to 5 percent and no interupts were seen in the test.
It may be a stupid question ,but can someone give some ideas on why would my CPU always run at 25 percent:
ast pid: 8237; load averages: 1.03, 0.98, 0.95; b up 0+05:10:12 13:40:48
92 processes: 1 running, 91 sleeping
CPU: 0.1% user, 0.0% nice, 0.0% system, 24.0% interrupt, 75.9% idle
Mem: 338M Active, 3370M Inact, 1310M Wired, 10G Free
ARC: 622M Total, 370M MFU, 219M MRU, 4887K Header, 23M Other
511M Compressed, 1055M Uncompressed, 2.06:1 Ratio
Swap: 2048M Total, 2048M Free
PID USERNAME THR PRI NICE SIZE RES STATE C TIME WCPU COMMAND
400 root 30 20 0 376M 267M kqread 3 0:45 0.15% python3.
4326 88 59 20 0 2330M 617M select 2 0:34 0.10% mysqld
8237 root 1 20 0 14M 4212K CPU3 3 0:00 0.03% top
3042 535 4 20 0 34M 9792K kqread 2 0:03 0.02% redis-se
3011 root 7 20 0 65M 33M select 2 0:02 0.01% python3.
1514 www 1 20 0 38M 10M kqread 1 0:00 0.00% nginx
1427 ntpd 1 20 0 21M 7144K select 2 0:00 0.00% ntpd
1456 root 8 20 0 52M 12M select 1 0:11 0.00% rrdcache
3046 root 1 20 0 616M 32M kqread 1 0:00 0.00% php-fpm
1383 root 1 -52 r0 13M 13M nanslp 2 0:00 0.00% watchdog
1523 root 11 20 0 114M 52M nanslp 2 0:23 0.00% collectd
I am running nextcloud on it ,but even before i configured and installed nexcloud i had the same issue.
I am running a baremetal:
Intel(R) Core(TM) i5-7200U CPU @ 2.50GHz
16gb RAM
with TrueNas core
TrueNAS-13.0-U5.1
Here is also top -P:
last pid: 8288; load averages: 1.05, 1.01, 0.96; b up 0+05:13:56 13:44:32
92 processes: 1 running, 91 sleeping
CPU 0: 0.0% user, 0.0% nice, 0.0% system, 97.6% interrupt, 2.4% idle
CPU 1: 0.0% user, 0.0% nice, 0.0% system, 0.5% interrupt, 99.5% idle
CPU 2: 0.5% user, 0.0% nice, 0.0% system, 0.0% interrupt, 99.5% idle
CPU 3: 0.5% user, 0.0% nice, 0.0% system, 0.0% interrupt, 99.5% idle
Mem: 336M Active, 3376M Inact, 1310M Wired, 10G Free
ARC: 625M Total, 370M MFU, 223M MRU, 4882K Header, 23M Other
511M Compressed, 1055M Uncompressed, 2.06:1 Ratio
Swap: 2048M Total, 2048M Free
PID USERNAME THR PRI NICE SIZE RES STATE C TIME WCPU COMMAND
8288 root 1 21 0 14M 4208K CPU3 3 0:00 0.12% top
4326 88 59 20 0 2330M 617M select 3 0:34 0.11% mysqld
400 root 30 21 0 378M 268M kqread 3 0:46 0.06% python3.
3042 535 4 20 0 34M 9792K kqread 2 0:03 0.02% redis-se
3011 root 7 20 0 65M 33M select 2 0:03 0.02% python3.
1514 www 1 20 0 38M 10M kqread 2 0:00 0.00% nginx
1427 ntpd 1 20 0 21M 7144K select 1 0:00 0.00% ntpd
1456 root 8 20 0 52M 12M select 3 0:11 0.00% rrdcache
3046 root 1 20 0 616M 32M kqread 2 0:00 0.00% php-fpm
The only test I have done is upgrade the BIOS to the latest and test with windows 11 as a operating system if the CPU will get such interupts also.
Windows 11 was running at 1 to 5 percent and no interupts were seen in the test.