Hi everyone,
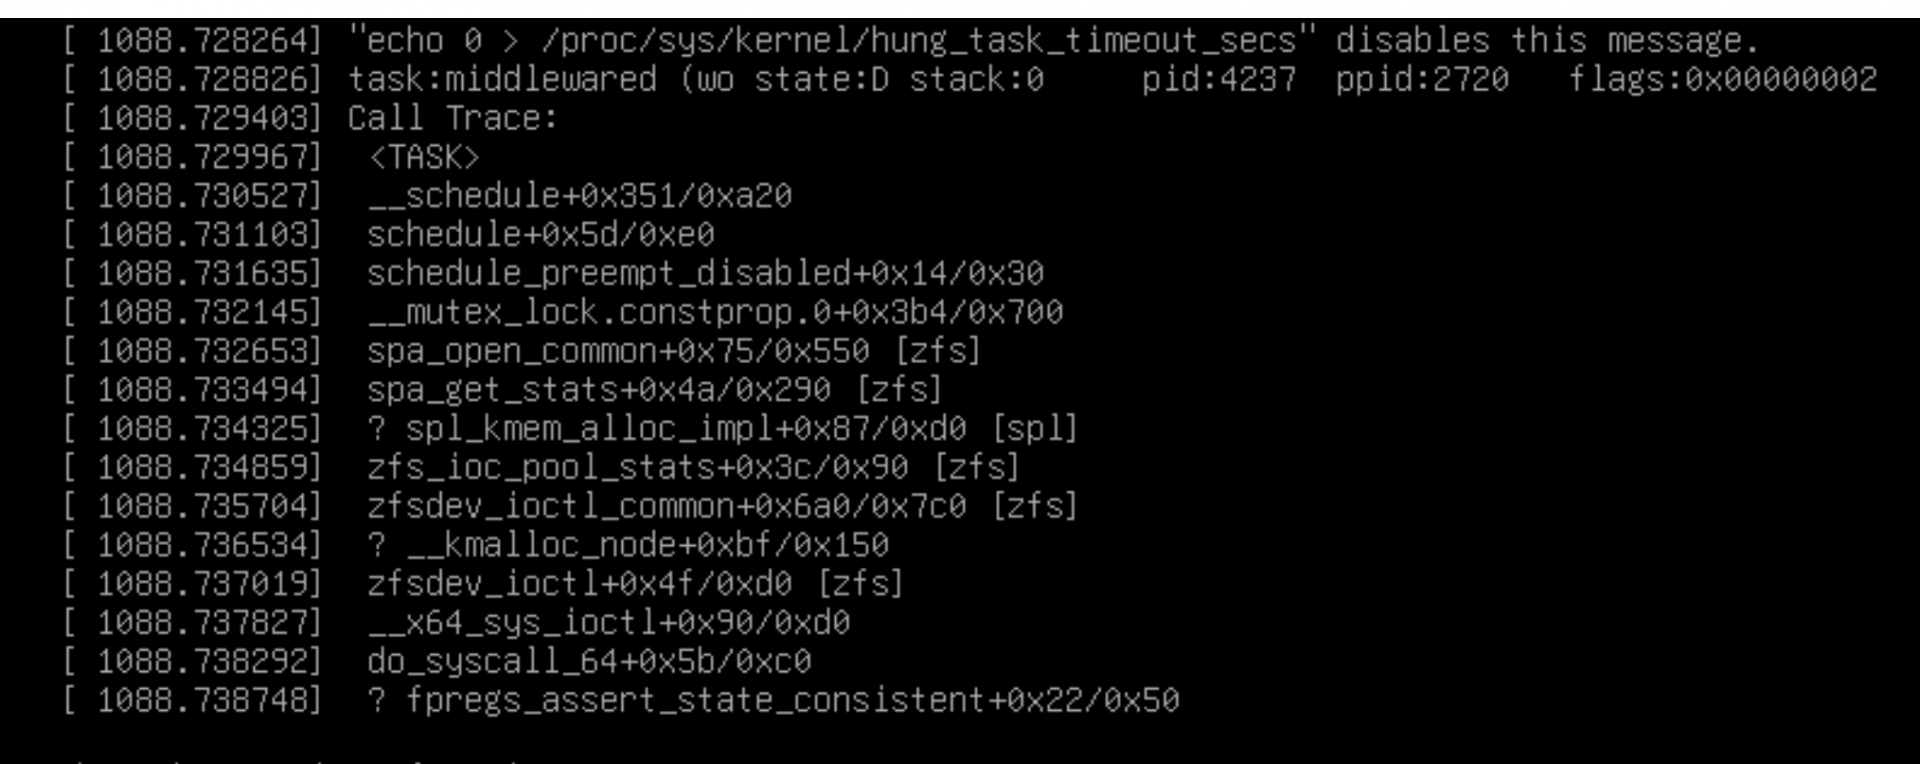
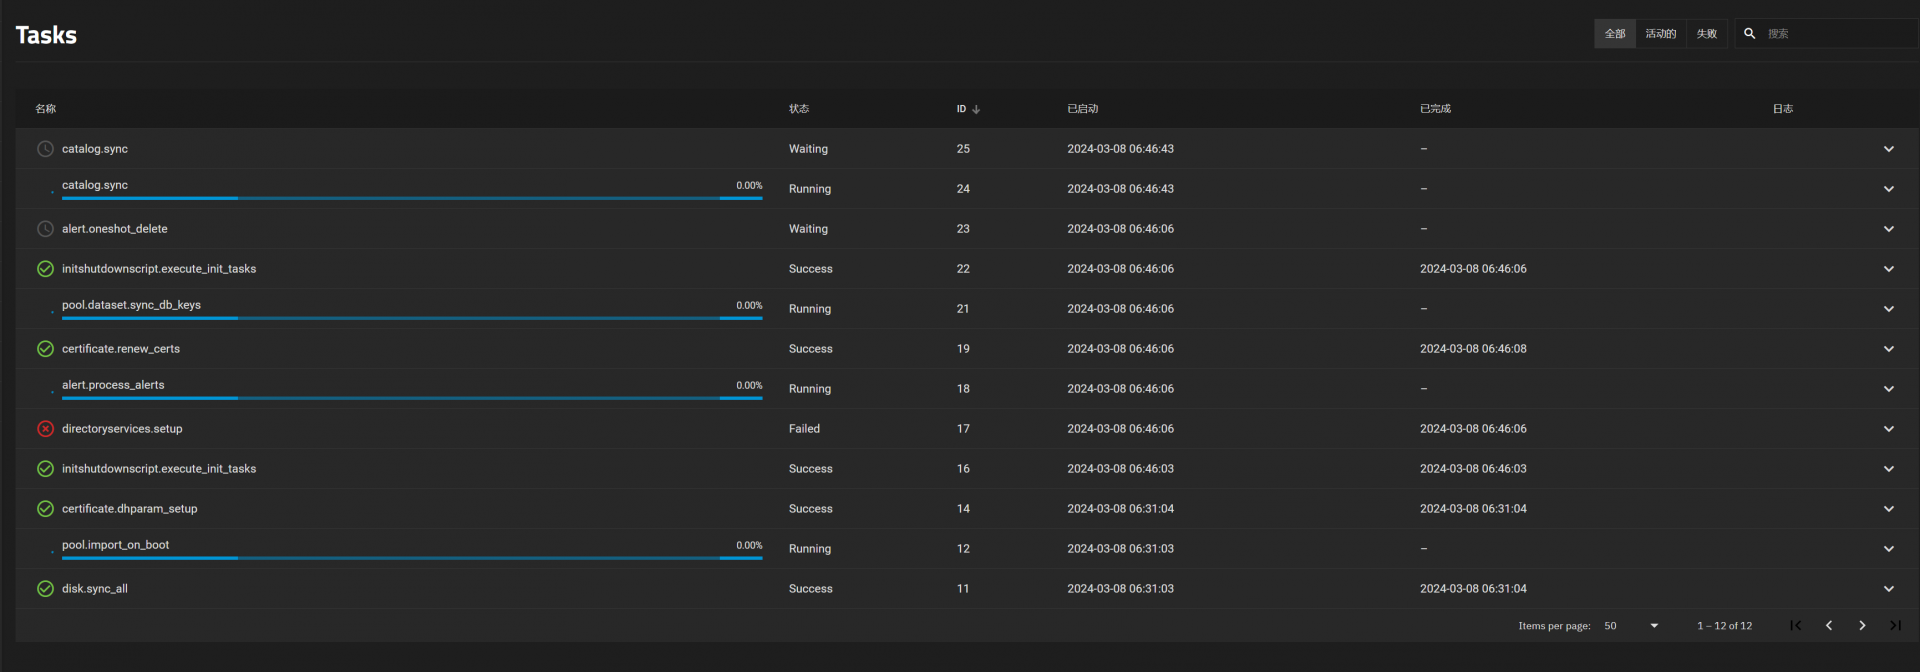
I've observed that the pool.import_on_boot task appears to be constantly running on my system. This task is supposed to import ZFS pools at system startup, ensuring that all data in the pools is readily available as soon as the system boots. However, it seems like this process is taking longer than expected or is possibly stuck in an endless loop.
Has anyone else experienced this issue where the pool.import_on_boot task continues to run without completing? Are there any known issues that could cause this behavior, or could it be related to the size or configuration of my ZFS pools?
I'm looking for insights into why this might be happening and how I can resolve it to ensure my ZFS pools are imported efficiently at boot time.
Thanks in advance for any advice or guidance you can provide!
View attachment 76389
View attachment 76390
Hello everyone,
I'm currently experiencing an issue with my TrueNAS setup, specifically with unusually high %iowait values and zero write output on some devices. Below are snippets from the iostat command that illustrate the situation over several intervals:
avg-cpu: %user %nice %system %iowait %steal %idle
0.01 0.00 0.53 56.99 0.00 42.48
...
avg-cpu: %user %nice %system %iowait %steal %idle
0.02 0.00 0.60 57.16 0.00 42.22
...
avg-cpu: %user %nice %system %iowait %steal %idle
0.12 0.00 0.67 55.23 0.00 43.98
Code:
avg-cpu:  %user   %nice %system %iowait  %steal   %idle
           0.01    0.00    0.53   56.99    0.00   42.48

Device             tps    kB_read/s    kB_wrtn/s    kB_dscd/s    kB_read    kB_wrtn    kB_dscd
dm-0              0.00         0.00         0.00         0.00          0          0          0
md127             0.00         0.00         0.00         0.00          0          0          0
sda              44.60       178.40         0.00         0.00        892          0          0
sdb              49.20       196.80         0.00         0.00        984          0          0
sdc              32.80       131.20         0.00         0.00        656          0          0
sdd              34.40       137.60         0.00         0.00        688          0          0
sde             272.20      1088.80         0.00         0.00       5444          0          0
sdf               0.00         0.00         0.00         0.00          0          0          0
sdg              34.00       136.00         0.00         0.00        680          0          0
sdh             264.40      1060.00         0.00         0.00       5300          0          0
sdi              44.40       177.60         0.00         0.00        888          0          0
sdj             271.00      1084.00         0.00         0.00       5420          0          0
sdk             279.40      1117.60         0.00         0.00       5588          0          0
sdl             273.80      1095.20         0.00         0.00       5476          0          0
sdm               7.60         0.00       121.60         0.00          0        608          0
sdn               7.20         0.00       120.80         0.00          0        604          0


avg-cpu:  %user   %nice %system %iowait  %steal   %idle
           0.02    0.00    0.60   57.16    0.00   42.22

Device             tps    kB_read/s    kB_wrtn/s    kB_dscd/s    kB_read    kB_wrtn    kB_dscd
dm-0              0.00         0.00         0.00         0.00          0          0          0
md127             0.00         0.00         0.00         0.00          0          0          0
sda              53.00       212.00         0.00         0.00       1060          0          0
sdb              52.00       208.00         0.00         0.00       1040          0          0
sdc              41.60       166.40         0.00         0.00        832          0          0
sdd              38.60       154.40         0.00         0.00        772          0          0
sde             297.20      1188.80         0.00         0.00       5944          0          0
sdf               0.00         0.00         0.00         0.00          0          0          0
sdg              38.60       154.40         0.00         0.00        772          0          0
sdh             294.00      1176.00         0.00         0.00       5880          0          0
sdi              52.00       208.00         0.00         0.00       1040          0          0
sdj             299.00      1196.00         0.00         0.00       5980          0          0
sdk             302.20      1208.80         0.00         0.00       6044          0          0
sdl             306.60      1226.40         0.00         0.00       6132          0          0
sdm               9.40         0.00       384.00         0.00          0       1920          0
sdn               9.60         0.00       384.00         0.00          0       1920          0


avg-cpu:  %user   %nice %system %iowait  %steal   %idle
           0.12    0.00    0.67   55.23    0.00   43.98

Device             tps    kB_read/s    kB_wrtn/s    kB_dscd/s    kB_read    kB_wrtn    kB_dscd
dm-0              0.00         0.00         0.00         0.00          0          0          0
md127             0.00         0.00         0.00         0.00          0          0          0
sda              49.80       199.20         0.00         0.00        996          0          0
sdb              49.60       198.40         0.00         0.00        992          0          0
sdc              38.40       153.60         0.00         0.00        768          0          0
sdd              40.80       163.20         0.00         0.00        816          0          0
sde             313.80      1256.00         0.00         0.00       6280          0          0
sdf               0.00         0.00         0.00         0.00          0          0          0
sdg              37.00       148.00         0.00         0.00        740          0          0
sdh             310.40      1250.40         0.00         0.00       6252          0          0
sdi              48.20       192.80         0.00         0.00        964          0          0
sdj             310.60      1243.20         0.00         0.00       6216          0          0
sdk             307.20      1232.00         0.00         0.00       6160          0          0
sdl             302.80      1212.00         0.00         0.00       6060          0          0
sdm               9.00         0.00        96.00         0.00          0        480          0
sdn               9.00         0.00        96.80         0.00          0        484          0
As observed, the %iowait is significantly high across multiple readings, indicating that the CPU is often waiting on I/O operations to complete. Interestingly, devices such as sdm and sdn show write operations but no read activity, while the majority of other devices (sda to sdl) are actively reading but not writing.
Given this data:
- What could be causing such high %iowait times, especially with zero write output on most devices?
- Are there any specific configurations or diagnostics I should look into to better understand and resolve this issue?
- Could this situation suggest a misconfiguration in my ZFS pool, or is it indicative of underlying hardware issues?
Any insights or recommendations would be greatly appreciated. I'm particularly interested in any advice on how to diagnose these I/O wait times and optimize my storage pool's performance.
Thank you in advance for your help!


