HarambeLives
Contributor
- Joined
- Jul 19, 2021
- Messages
- 153
Maybe I just need more coffee, but where on earth do I view the actual results?
Storage > Pools > Status shows all drives online and good
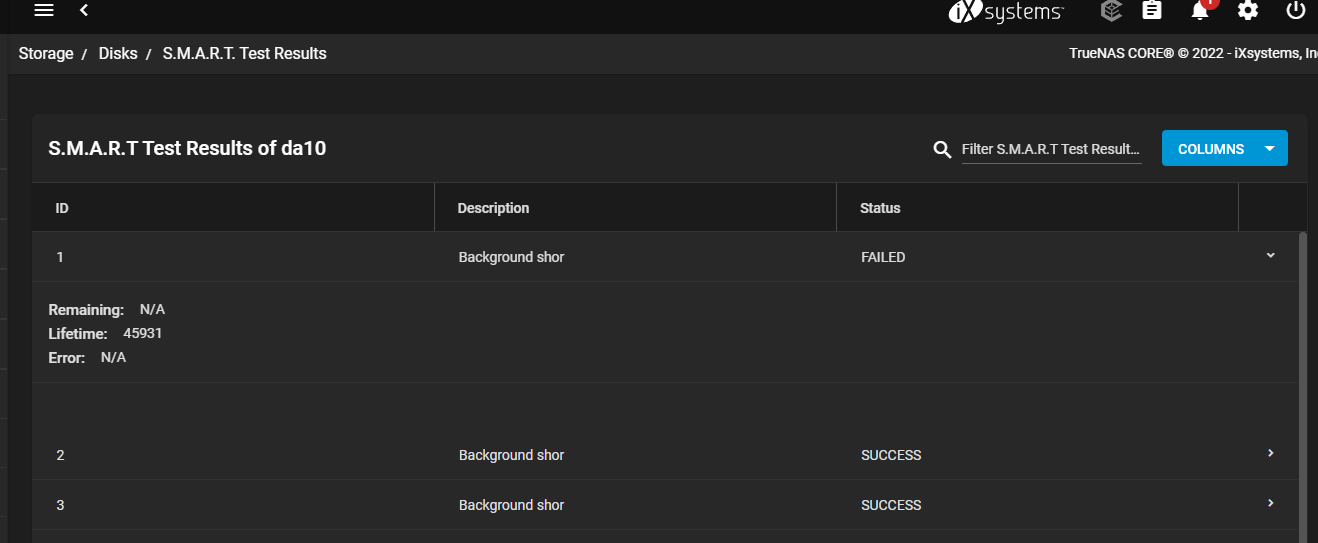
Disks > da10 > Dropdown > SMART Test Results doesn't seem to show me any results. Am I missing something here? this is what I see

So I went into CLI and figured I could maybe see the results there, but still no
I can see there that it failed on segment 3, but what the heck is segment 3? Is there a way to drill down further?
Storage > Pools > Status shows all drives online and good
Disks > da10 > Dropdown > SMART Test Results doesn't seem to show me any results. Am I missing something here? this is what I see
So I went into CLI and figured I could maybe see the results there, but still no
Code:
smartctl 7.2 2020-12-30 r5155 [FreeBSD 12.2-RELEASE-p14 amd64] (local build)
Copyright (C) 2002-20, Bruce Allen, Christian Franke, www.smartmontools.org

=== START OF INFORMATION SECTION ===
Vendor:               HGST
Product:              H7280A520SUN8.0T
Revision:             PAG1
Compliance:           SPC-4
User Capacity:        7,865,536,647,168 bytes [7.86 TB]
Logical block size:   512 bytes
Physical block size:  4096 bytes
Formatted with type 1 protection
8 bytes of protection information per logical block
LU is fully provisioned
Rotation Rate:        7200 rpm
Form Factor:          3.5 inches
Logical Unit id:      0x5000cca260bd5228
Serial number:        001649PB3R5V        VLKB3R5V
Device type:          disk
Transport protocol:   SAS (SPL-3)
Local Time is:        Sat Oct 15 09:18:21 2022 CDT
SMART support is:     Available - device has SMART capability.
SMART support is:     Enabled
Temperature Warning:  Enabled

=== START OF READ SMART DATA SECTION ===
SMART Health Status: OK

Current Drive Temperature:     36 C
Drive Trip Temperature:        85 C

Accumulated power on time, hours:minutes 45940:36
Manufactured in week 49 of year 2016
Specified cycle count over device lifetime:  50000
Accumulated start-stop cycles:  37
Specified load-unload count over device lifetime:  600000
Accumulated load-unload cycles:  1940
Elements in grown defect list: 0

Vendor (Seagate Cache) information
  Blocks sent to initiator = 21759842658025472

Error counter log:
           Errors Corrected by           Total   Correction     Gigabytes    Total
               ECC          rereads/    errors   algorithm      processed    uncorrected
           fast | delayed   rewrites  corrected  invocations   [10^9 bytes]  errors
read:          0       23         0        23   18569405    1390483.328           0
write:         0       13         0        13   12180425     902791.191           0
verify:        0        0         0         0      84772          1.273           0

Non-medium error count:        0

SMART Self-test log
Num  Test              Status                 segment  LifeTime  LBA_first_err [SK ASC ASQ]
     Description                              number   (hours)
# 1  Background short  Failed in segment -->       3   45931                 - [0x1 0x5d 0xfd]
# 2  Background short  Completed                   -   45907                 - [-   -    -]
# 3  Background short  Completed                   -   45883                 - [-   -    -]
# 4  Background short  Completed                   -   45859                 - [-   -    -]
# 5  Background short  Completed                   -   45835                 - [-   -    -]
# 6  Background short  Completed                   -   45811                 - [-   -    -]
# 7  Background short  Completed                   -   45787                 - [-   -    -]
# 8  Background short  Completed                   -   45763                 - [-   -    -]
# 9  Background short  Completed                   -   45739                 - [-   -    -]
#10  Background short  Completed                   -   45715                 - [-   -    -]
#11  Background short  Completed                   -   45691                 - [-   -    -]
#12  Background short  Completed                   -   45667                 - [-   -    -]
#13  Background short  Completed                   -   45643                 - [-   -    -]
#14  Background short  Completed                   -   45619                 - [-   -    -]
#15  Background short  Completed                   -   45595                 - [-   -    -]
#16  Background short  Completed                   -   45571                 - [-   -    -]
#17  Background short  Completed                   -   45547                 - [-   -    -]
#18  Background short  Completed                   -   45523                 - [-   -    -]
#19  Background short  Completed                   -   45499                 - [-   -    -]
#20  Background short  Completed                   -   45475                 - [-   -    -]

Long (extended) Self-test duration: 63865 seconds [1064.4 minutes]
I can see there that it failed on segment 3, but what the heck is segment 3? Is there a way to drill down further?
