Which Drives is FreeNAS using and in What Configuration?

Status
Not open for further replies.

jimjamz

Cadet
Joined
Dec 12, 2015
Messages
7
Hello all,

This morning I installed FreeNAS onto a machine that has a disk configuration of 2x Western Digital 2TB Greens using the onboard SATA-II controller (JMB36X) and 1x Western Digital 1TB Blue on the onboard SATA-I controller.

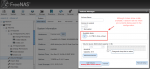
Once installed, when initially going through the FreeNAS setup via my browser, the only disk configuration I was offered was "Auto". I couldn't choose anything else. From the drives it said it was going to format, it seemed to only be interested in the WD 2TB Greens.

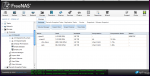
Is there a way I can visualise which drives are actually being utilised by FreeNAS and what their configuration (and filesystem) are? I've been reading though the Getting Started documentation but this doesn't seem so clear.
 

pirateghost

Unintelligible Geek
Joined
Feb 29, 2012
Messages
4,219
the filesystem is easy. FreeNAS only offers ZFS.

I am guessing that it set up a MIRROR with your 2 2tb drives. It probably wouldnt even use the 1tb because it is a different size.

in the GUI, you can click on the pool, and on the bottom you will see some buttons. the one on the end is the volume status
 

jimjamz

Cadet
Joined
Dec 12, 2015
Messages
7
Hey @pirateghost - Thanks for the reply.
It's great to know that FreeNAS will always use ZFS. Before installing FreeNAS, I was worried about spending too much time on whether to push my machine to it's absolute limits and sacrifice a lot of storage for the sake of this filesystem, and instead just to plump with one of the other standards (NTFS, EXT4 etc..). However, given that there really is no option but to go with ZFS, it actually makes life easier and I just know I have to get on with it! :-D

I'm still a complete FreeNAS n00b so please bear with my dumbness here. I'm just not seeing the information I require within the Storage -> Volumes section of the FreeNAS GUI. I have selected my pool, which exposes the shares I've already set up within the navigational tree on the left (see screenshot). However, clicking on any of these doesn't show any relevant information about which drives in the system are being used by FreeNAS, and what configuration they are running in.
index.php


Storage -> Volumes -> View Volumes - This shows me the pool and the space available, but not which disks are being used in it.
index.php


Storage -> Volumes -> View Disks
- Just shows me the disks recognised by FreeNAS.
index.php

I'm on the latest stable (9.3).

Presently, it seems that FreeNAS rather implies which disks are being used, rather than specifying this information to the user in an obvious way.
 

Attachments

  • Screen shot 2015-12-13 at 19.43.46.png
    Screen shot 2015-12-13 at 19.43.46.png
    68.9 KB · Views: 390
  • Screen shot 2015-12-13 at 19.29.55.png
    Screen shot 2015-12-13 at 19.29.55.png
    154.6 KB · Views: 416
  • Screen shot 2015-12-13 at 20.00.26.png
    Screen shot 2015-12-13 at 20.00.26.png
    93.4 KB · Views: 389

pirateghost

Unintelligible Geek
Joined
Feb 29, 2012
Messages
4,219
Click on the very top jpool1. Then look at the buttons on the bottom of the page that show up.

Volume manager is for making new vdevs/pools. It doesn't show you what you are already using.

The only disks that will show up in volume manager are disks that aren't being used.
 

jimjamz

Cadet
Joined
Dec 12, 2015
Messages
7
Click on the very top jpool1. Then look at the buttons on the bottom of the page that show up.

I don't see any buttons at the bottom of the page. Am I missing something?
index.php


I am guessing that it set up a MIRROR with your 2 2tb drives.
Is there a place where I can see this information, so I can understand what configuration I'm using?

It probably wouldnt even use the 1tb because it is a different size.
When I go into Volume Manager, I can see that the WD 1TB is not being used because it's saying it's an available disk and I can add it. However, let's say I had a machine with 10 drives, and it said 2 were available disks. How would I really know that other 8 drives are being used, without assuming it?
 

Attachments

  • Screen shot 2015-12-14 at 18.50.50.png
    Screen shot 2015-12-14 at 18.50.50.png
    160.4 KB · Views: 391

depasseg

FreeNAS Replicant
Joined
Sep 16, 2014
Messages
2,874
Run "zpool status" from an ssh terminal. It will give you something that looks like this:
Code:
[root@freenas1] ~# zpool status
  pool: backup-tank
state: ONLINE
  scan: scrub repaired 0 in 9h46m with 0 errors on Sun Dec 13 09:46:46 2015
config:

        NAME                                            STATE     READ WRITE CKSUM
        backup-tank                                     ONLINE       0     0     0
          raidz2-0                                      ONLINE       0     0     0
            gptid/47f4175e-816a-11e5-a89a-002590fbfb40  ONLINE       0     0     0
            gptid/48d8d60b-816a-11e5-a89a-002590fbfb40  ONLINE       0     0     0
            gptid/49bd46ca-816a-11e5-a89a-002590fbfb40  ONLINE       0     0     0
            gptid/4ab3e647-816a-11e5-a89a-002590fbfb40  ONLINE       0     0     0
            gptid/4b9e6364-816a-11e5-a89a-002590fbfb40  ONLINE       0     0     0
            gptid/4c862ac8-816a-11e5-a89a-002590fbfb40  ONLINE       0     0     0
            gptid/4d72ebb5-816a-11e5-a89a-002590fbfb40  ONLINE       0     0     0
            gptid/4e5c9527-816a-11e5-a89a-002590fbfb40  ONLINE       0     0     0
            gptid/4f4a31ea-816a-11e5-a89a-002590fbfb40  ONLINE       0     0     0
            gptid/5031936b-816a-11e5-a89a-002590fbfb40  ONLINE       0     0     0
          raidz2-1                                      ONLINE       0     0     0
            gptid/512c0226-816a-11e5-a89a-002590fbfb40  ONLINE       0     0     0
            gptid/521d5ff4-816a-11e5-a89a-002590fbfb40  ONLINE       0     0     0
            gptid/5303de29-816a-11e5-a89a-002590fbfb40  ONLINE       0     0     0
            gptid/53f91f2c-816a-11e5-a89a-002590fbfb40  ONLINE       0     0     0
            gptid/54daed66-816a-11e5-a89a-002590fbfb40  ONLINE       0     0     0
            gptid/55ded62d-816a-11e5-a89a-002590fbfb40  ONLINE       0     0     0
            gptid/56e46d23-816a-11e5-a89a-002590fbfb40  ONLINE       0     0     0
            gptid/57d64d4c-816a-11e5-a89a-002590fbfb40  ONLINE       0     0     0
            gptid/58cb455a-816a-11e5-a89a-002590fbfb40  ONLINE       0     0     0
            gptid/59aa77d7-816a-11e5-a89a-002590fbfb40  ONLINE       0     0     0
          raidz2-2                                      ONLINE       0     0     0
            gptid/5aa26b53-816a-11e5-a89a-002590fbfb40  ONLINE       0     0     0
            gptid/5b7a49d6-816a-11e5-a89a-002590fbfb40  ONLINE       0     0     0
            gptid/5cc27257-816a-11e5-a89a-002590fbfb40  ONLINE       0     0     0
            gptid/5dfda90e-816a-11e5-a89a-002590fbfb40  ONLINE       0     0     0
            gptid/5f4e8c42-816a-11e5-a89a-002590fbfb40  ONLINE       0     0     0
            gptid/60301043-816a-11e5-a89a-002590fbfb40  ONLINE       0     0     0
        spares
          gptid/854c08bc-8a11-11e5-969d-002590fbfb40    AVAIL  

errors: No known data errors

  pool: backup-tank2
state: DEGRADED
status: One or more devices has been taken offline by the administrator.
        Sufficient replicas exist for the pool to continue functioning in a
        degraded state.
action: Online the device using 'zpool online' or replace the device with
        'zpool replace'.
  scan: none requested
config:

        NAME                                            STATE     READ WRITE CKSUM
        backup-tank2                                    DEGRADED     0     0     0
          raidz1-0                                      DEGRADED     0     0     0
            gptid/6c9419be-9654-11e5-87db-001f33eaf869  ONLINE       0     0     0
            gptid/6d54648c-9654-11e5-87db-001f33eaf869  ONLINE       0     0     0
            gptid/6e0f6e32-9654-11e5-87db-001f33eaf869  ONLINE       0     0     0
            gptid/6ec82f73-9654-11e5-87db-001f33eaf869  ONLINE       0     0     0
            4440998044591230907                         OFFLINE      0     0     0  was /dev/gptid/9521ba9a-9654-11e5-87db-001f33eaf869
            gptid/9d5448ba-9654-11e5-87db-001f33eaf869  ONLINE       0     0     0

errors: No known data errors

  pool: freenas-boot
state: ONLINE
  scan: scrub repaired 0 in 0h27m with 0 errors on Sat Dec  5 04:12:29 2015
config:

        NAME                                            STATE     READ WRITE CKSUM
        freenas-boot                                    ONLINE       0     0     0
          mirror-0                                      ONLINE       0     0     0
            gptid/70d43788-80be-11e4-b68d-002590fbfb40  ONLINE       0     0     0
            gptid/04fb5c1a-9b79-11e4-a597-002590fbfb40  ONLINE       0     0     0

errors: No known data errors

  pool: tank
state: ONLINE
  scan: none requested
config:

        NAME                                            STATE     READ WRITE CKSUM
        tank                                            ONLINE       0     0     0
          raidz2-0                                      ONLINE       0     0     0
            gptid/f0f1f829-7f5c-11e5-8d67-002590fbfb40  ONLINE       0     0     0
            gptid/f44b5e06-7f5c-11e5-8d67-002590fbfb40  ONLINE       0     0     0
            gptid/f7b6be5b-7f5c-11e5-8d67-002590fbfb40  ONLINE       0     0     0
            gptid/fb1109fc-7f5c-11e5-8d67-002590fbfb40  ONLINE       0     0     0
            gptid/fe7a0d91-7f5c-11e5-8d67-002590fbfb40  ONLINE       0     0     0
            gptid/01cf6ea8-7f5d-11e5-8d67-002590fbfb40  ONLINE       0     0     0
            gptid/05303815-7f5d-11e5-8d67-002590fbfb40  ONLINE       0     0     0
            gptid/0889c7ae-7f5d-11e5-8d67-002590fbfb40  ONLINE       0     0     0
            gptid/0beb5218-7f5d-11e5-8d67-002590fbfb40  ONLINE       0     0     0
            gptid/0f60d4db-7f5d-11e5-8d67-002590fbfb40  ONLINE       0     0     0
            gptid/12bbe0d6-7f5d-11e5-8d67-002590fbfb40  ONLINE       0     0     0
        logs
          gptid/13491c6f-7f5d-11e5-8d67-002590fbfb40    ONLINE       0     0     0
        cache
          gptid/da71277a-832f-11e5-b2db-002590fbfb40    ONLINE       0     0     0

errors: No known data errors
[root@freenas1] ~# 
 

gpsguy

Active Member
Joined
Jan 22, 2012
Messages
4,472
If you went into the shell and typed "zpool status"!without the quotes, you would be able to see the 8 drives and they were being used. For example, an 8 drive RAIDz2 volume or a volume containing 4 sets of mirrors.

The command lists the gptid of the drive, so you would need to do a little extra work to match it up with the serial numbers of the drives.

What ever you do, keep good notes on your build. If you have a problem in the future it will be handy to have.


Sent from my phone
 

danb35

Hall of Famer
Joined
Aug 16, 2011
Messages
15,504

jimjamz

Cadet
Joined
Dec 12, 2015
Messages
7
Hi,

@pirateghost - I can now see those buttons. Indeed, I wasn't selecting the actual pool in the list. Sorry, but the UI just didn't seem that intuitive at first glance. Using these buttons, they still didn't show me the information I wanted. I still don't know what configuration the drives are in or which ones are being used.
Fortunately, the terminal command @depasseg provided did the trick. Thanks!
 

pirateghost

Unintelligible Geek
Joined
Feb 29, 2012
Messages
4,219
It is literally a button called 'VOLUME STATUS' which just displays 'zpool status' in the web gui.....
 

danb35

Hall of Famer
Joined
Aug 16, 2011
Messages
15,504
Yeah, but it isn't labeled "volume status". It's a picture of a sheet of notebook paper. How anyone's supposed to mentally connect that with "volume status" without having been told is beyond me. Sure, you know that, and I know that (and someone who's RTFM carefully knows it, though it isn't stated all that clearly even there), but it's hardly intuitive. I guess it's in the spirit of internationalization--replace words that some people can't understand with an icon nobody can understand.
 

pirateghost

Unintelligible Geek
Joined
Feb 29, 2012
Messages
4,219
Yeah, but it isn't labeled "volume status". It's a picture of a sheet of notebook paper. How anyone's supposed to mentally connect that with "volume status" without having been told is beyond me. Sure, you know that, and I know that (and someone who's RTFM carefully knows it, though it isn't stated all that clearly even there), but it's hardly intuitive. I guess it's in the spirit of internationalization--replace words that some people can't understand with an icon nobody can understand.
except if you hover over it. it says 'Volume Status'


I won't deny that the GUI is not very intuitive in parts, but when exploring, usually one would take the time to try and figure out what each button does...
 

Bidule0hm

Server Electronics Sorcerer
Joined
Aug 5, 2013
Messages
3,710
Yeah, but it takes time to hover each button in the GUI... :D
 
Status
Not open for further replies.
Top