[SOLVED] Differing ARC Usage in FreeNAS-9.10.2

Status
Not open for further replies.

MrToddsFriends

Documentation Browser
Joined
Jan 12, 2015
Messages
1,338
After updating to FreeNAS-9.10.2 (a476f16) the ARC reporting graphs look substantially different than with any other 9.10 version before on my system. In the attached screenshot two reboots after performing the update in the morning of Doc 20 are visible. While the ARC Size graph looks pretty usual, the ARC Hit Ratio and ARC Requests graphs look substantially different that before, using 9.10.1-U4.

Using Bidule0hm's ARC statistics script shows a very low ARC Hit Ratio on my system after updating, too, so it's not only the reporting graphs that are different in FreeNAS-9.10.2.
 

Attachments

  • ZFS_m.png
    ZFS_m.png
    64.9 KB · Views: 643

Spearfoot

He of the long foot
Moderator
Joined
May 13, 2015
Messages
2,478
After updating to FreeNAS-9.10.2 (a476f16) the ARC reporting graphs look substantially different than with any other 9.10 version before on my system. In the attached screenshot two reboots after performing the update in the morning of Doc 20 are visible. While the ARC Size graph looks pretty usual, the ARC Hit Ratio and ARC Requests graphs look substantially different that before, using 9.10.1-U4.

Using Bidule0hm's ARC statistics script shows a very low ARC Hit Ratio on my system after updating, too, so it's not only the reporting graphs that are different in FreeNAS-9.10.2.
I noticed the same thing after updating my 'test' system to 9.10.2, but the ARC size and Hit Ratio both returned to more-or-less typical values after I exercised the system. Specifically, I loaded a Windows 7 virtual machine on storage provided as an NFS datastore by the server, ran Windows update, ran a Crystal disk benchmark, and ran an rsync job to copy some files.

I'm not saying there isn't a problem. But it could just be that the system needs to be utilized for a while before the ARC statistics become realistic.

arc-usage-9.10.2.jpg
 
Last edited:

MrToddsFriends

Documentation Browser
Joined
Jan 12, 2015
Messages
1,338
Thanks Spearfoot and Mlovelace for your feedback.

I think I found the reason why the ARC reporting graphs in 9.10.2 look different on my system. The Changelog for this version has the following entry:

#16901 Bug Ready For Release Nice to have Periodic snapshots - autosnap - generate large demand on ARC metadata.

The ARC Requests (demand metadata) graph showed a rectangular wave behavior in prior versions with high level between 6:00 and 23:00 on my system, exactly the time span during which snapshots are scheduled.

So it seems that the high ARC Hit Ratio I saw on my system prior to 9.10.2 was biased by the (now improved) autosnap functionality.
 

DrKK

FreeNAS Generalissimo
Joined
Oct 15, 2013
Messages
3,630
Indeed. Ever since I upgraded to 9.10.2, I have pretty much been at a solid 40%'ish ARC hit ratio. It doesn't appear really to be going up either. Previously, I was in the low to mid 90%'s on my ARC hit.

Now, my FreeNAS is pretty tame. It doesn't get a lot of use for serving a lot of data, so perhaps it will take some time for the ARC to mature or something. But I'm really having terrible hit ratios now, with no obvious upward trend line, ever since I upgraded.
 

Scharbag

Guru
Joined
Feb 1, 2012
Messages
620
Indeed. Ever since I upgraded to 9.10.2, I have pretty much been at a solid 40%'ish ARC hit ratio. It doesn't appear really to be going up either. Previously, I was in the low to mid 90%'s on my ARC hit.

Now, my FreeNAS is pretty tame. It doesn't get a lot of use for serving a lot of data, so perhaps it will take some time for the ARC to mature or something. But I'm really having terrible hit ratios now, with no obvious upward trend line, ever since I upgraded.
Same here. I am sitting at a stable 36% hit ratio with no real upward trend since I updated. I did restart again yesterday due to some changes that I made. System now has 64GB of ram (used to have 70, playing with VM stuff).

Here are my stats:

  • Movies, Data, VMs shared over NFS to ESXi
  • 4:03PM up 1 day, 5:11, 1 user, load averages: 0.77, 0.68, 0.62
  • 20.7TiB / 32.5TiB (backuptank)
  • 25.5TiB / 43.5TiB (bigtank)
  • 74.2GiB / 444GiB (fasttank)
  • 1.52GiB / 15.9GiB (freenas-boot)
  • 53.10GiB (MRU: 38.16GiB, MFU: 15.03GiB) / 64.00GiB
  • Hit ratio -> 35.68% (higher is better)
  • Prefetch -> 77.64% (higher is better)
  • Hit MFU:MRU -> 29.02%:22.89% (higher ratio is better)
  • Hit MRU Ghost -> 0.27% (lower is better)
  • Hit MFU Ghost -> 0.31% (lower is better)

I know there has been very little time to prepare the ARC but it has been flatline for the last few hours and has actually decreased since the reboot (started at ~50% right after restarting the system).

Cheers,
 

DrKK

FreeNAS Generalissimo
Joined
Oct 15, 2013
Messages
3,630
Yeah, something is definitely "wrong". My graphs are below:

freenasarc.png


As you can see, at least if I'm reading this right, the big data requests look like they are mostly hitting, but the demand_metadata stuff is missing almost everything. This accounts for the low hit ratio, it would seem like.

That ARC usage of about 40% seems pinned. I have watched a few GB of movies, and it didn't budge the needle. Something is definitely up, here. Perhaps we should escalate this. Or, if it's normal behavior, and the old 90'ish% hit rates that we were accustomed to were red herrings given the new snapshot behavior, then we all need to be re-trained, so to speak. Either way we need something in the way of explanation or investigation.
 

DrKK

FreeNAS Generalissimo
Joined
Oct 15, 2013
Messages
3,630
Also, the ARC has been seasoned since the release of 9.10.2., and has had several hundred GB run through it by now. So the ARC is at least semi-mature, and the behavior we have up here seems to me to be the asymptotic reality.
 

MrToddsFriends

Documentation Browser
Joined
Jan 12, 2015
Messages
1,338
As you can see, at least if I'm reading this right, the big data requests look like they are mostly hitting, but the demand_metadata stuff is missing almost everything.

Seems to be depended on actual usage, which is no surprise (see attached screenshot, which shows two consecutive client side file searches using Windows Explorer, both after 22:40).

That ARC usage of about 40% seems pinned. I have watched a few GB of movies, and it didn't budge the needle.

The fact that usage (no movies stored here) and RAM/ARC size of my NAS system seems to be different, but I also see a almost pinned 40% ARC Hit Ratio in 9.10.2 is at least remarkable.

Something is definitely up, here. Perhaps we should escalate this. Or, if it's normal behavior, and the old 90'ish% hit rates that we were accustomed to were red herrings given the new snapshot behavior, then we all need to be re-trained, so to speak. Either way we need something in the way of explanation or investigation.

I always wondered why the reported ARC Hit Ratio in pre-9.10.2 versions was so unrealistically(?) high, I regularly saw values in the 85% range on my system ...

Let us know if you have ideas how to investigate this further.
 

Attachments

  • ZFS_m.png
    ZFS_m.png
    77.1 KB · Views: 534

Scharbag

Guru
Joined
Feb 1, 2012
Messages
620
Screen Shot 2016-12-31 at 10.18.15 AM.png


Ahh, if you hit full image it shows the image in the post... Neat!

Anywhoo, those are my ARC stats since December 24th (9.10.2 installed on the 21st). I rebooted after removing L2ARC on the 28th.

Screen Shot 2016-12-31 at 10.22.56 AM.png


While my system was never a hit ratio monster, it used to be a lot better than it is now.

Cheers,
 

m0nkey_

MVP
Joined
Oct 27, 2015
Messages
2,739
@DrKK and I had a discussion with Allen Jude yesterday evening.

What I took away from that, is what we're seeing now should be about normal for the average FreeNAS user. Obviously, the more you read from cache, the higher your hit ratio goes. Allen explained that if you have more RAM than storage, then you will see almost 100% hit ratio, but because most of us have on average 16GB RAM, and 6TB+ of storage, we're unlikely to see these high hit rates, unless of course you're re-reading the same data over and over again in cache.
 

Scharbag

Guru
Joined
Feb 1, 2012
Messages
620
@DrKK and I had a discussion with Allen Jude yesterday evening.

What I took away from that, is what we're seeing now should be about normal for the average FreeNAS user. Obviously, the more you read from cache, the higher your hit ratio goes. Allen explained that if you have more RAM than storage, then you will see almost 100% hit ratio, but because most of us have on average 16GB RAM, and 6TB+ of storage, we're unlikely to see these high hit rates, unless of course you're re-reading the same data over and over again in cache.
Makes sense. I have 64GB RAM with 50+TiB of storage, so yeah, the odds of me constantly reading the same file over and over again is slim.

Thank you for chasing this down and providing us with answers!

Cheers,
 

SweetAndLow

Sweet'NASty
Joined
Nov 6, 2013
Messages
6,421
I'll include mine for reference. Not as low as some people people but clearly a drop after the upgrade.
arc9.10.2.PNG
 

DrKK

FreeNAS Generalissimo
Joined
Oct 15, 2013
Messages
3,630
Just to reiterate what M0nkey has said above, and provide a few more details. We did, as M0nkey said, speak to Allan last night. He literally wrote the book on ZFS, and we all walked through it and discussed to make sure everything was right.

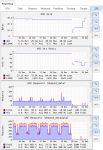
Basically, the way things used to be done, pre 9.10.2, was that a certain cron job accessed the very same file(s) over and over and over again, all day long during the continuous maintenance of the FreeNAS. Kind of an oversight. I had actually noticed this before, a couple years ago, but I was like, "meh", and never reported it. But now they are doing it apparently in a more sensible way (the bug report itself is "private", so I don't know what the details are on the fix). As a result, these files, which on account of their constant presence in the MRU/MFU, were always "hits", and so, all things considered, well over 90 percent of the "files" requested were magically in the cache, because well over 90 percent of the "files" requested was this thing from the script. Lol? So that means we'd all get stupid numbers. 95% hits, 92% hits, 97% hits.

In hindsight, these numbers have always been ridiculous, and it's kind of odd we never questioned it in the past. Numbers like 40 or 50% are actually just fine. Allan, the ZFS master, on his 128GB super servers from Hell, we did the math on his hit ratio, and he was getting like 70-75%.

The thing to remember: We have been accustomed to seeing 90+%, and it's been an illusion. Hit ratios of more like 1 in 3 or 1 in 2, are fine, SOP, for a personal ZFS system. We have to "un-accustom" ourselves to seeing 90+%

If you want to test your ARC and make sure it's working (it is working---trust me), choose some good sized file, say, (I'm assuming everyone is smart enough to find an appropriate file on their NAS, and add the appropriate directory path) Dune.mp4. Then do this:

Code:
sysctl -a | grep arcstats > /tmp/before.txt 
This saves your ARC stats before you attempt to "season" the ARC with Dune.
Code:
cat Dune.mp4 > /dev/null
This should load Dune into the ARC without doing anything else.
Code:
sysctl -a | grep arcstats > /tmp/after.txt
This saves your ARC stats after Dune is loaded into ARC.
Code:
cat Dune.mp4 > /dev/null
We do the same procedure, except this time, ZFS ought to know Dune is in the ARC, and not fetch it from disk.
Code:
sysctl -a | grep arcstats > /tmp/after2.txt
This saves your ARC stats after Dune is read out of the ARC.

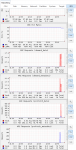
Now, when you look at your three files, /tmp/before.txt, /tmp/after.txt, and /tmp/after2.txt, you should be able to verify your arc is working. The difference between after.txt and before.txt should be evident. You should see, kstat.zfs.misc.arcstats.prefetch_data_misses going up significantly, and kstat.zfs.misc.arcstats.prefetch_data_hits going up only mildly, if at all. When you look at after2.txt versus after.txt, though, assuming your file was loaded from ARC, you will see kstat.zfs.misc.arcstats.misses *not* go up, you should see kstat.zfs.misc.arcstats.prefetch_data_misses *not* go up, etc.

Bottom line (not) up front: The "real" ARC Hit Ratio has always really been 40% or 50% or whatever for most of us. A slightly sub-optimal way of doing ongoing maintenance as the FreeNAS run resulted in artificially inflated numbers. Everyone (including me) can relax.
 
Last edited:

DrKK

FreeNAS Generalissimo
Joined
Oct 15, 2013
Messages
3,630

Scharbag

Guru
Joined
Feb 1, 2012
Messages
620
Code:
/Movies/Dune (1984) % grep prefetch /tmp/before.txt
kstat.zfs.misc.arcstats.demand_hit_predictive_prefetch: 1533893
kstat.zfs.misc.arcstats.prefetch_metadata_misses: 133664
kstat.zfs.misc.arcstats.prefetch_metadata_hits: 4575955
kstat.zfs.misc.arcstats.prefetch_data_misses: 2556474
kstat.zfs.misc.arcstats.prefetch_data_hits: 7578074
/Movies/Dune (1984) % grep prefetch /tmp/after.txt
kstat.zfs.misc.arcstats.demand_hit_predictive_prefetch: 1533905
kstat.zfs.misc.arcstats.prefetch_metadata_misses: 133801
kstat.zfs.misc.arcstats.prefetch_metadata_hits: 4576086
kstat.zfs.misc.arcstats.prefetch_data_misses: 2574375
kstat.zfs.misc.arcstats.prefetch_data_hits: 7591705
/Movies/Dune (1984) % grep prefetch /tmp/after2.txt
kstat.zfs.misc.arcstats.demand_hit_predictive_prefetch: 1533905
kstat.zfs.misc.arcstats.prefetch_metadata_misses: 133801
kstat.zfs.misc.arcstats.prefetch_metadata_hits: 4577208
kstat.zfs.misc.arcstats.prefetch_data_misses: 2574375
kstat.zfs.misc.arcstats.prefetch_data_hits: 7736042


Well what do ya know. Spot on good sir. Spot on.

Cheers,
 

MrToddsFriends

Documentation Browser
Joined
Jan 12, 2015
Messages
1,338

Ericloewe

Server Wrangler
Moderator
Joined
Feb 15, 2014
Messages
20,175
In hindsight, these numbers have always been ridiculous, and it's kind of odd we never questioned it in the past.
I agree. It's one of those things that was everywhere and nobody questioned it (and plenty of people messed around with these numbers).
 

DrKK

FreeNAS Generalissimo
Joined
Oct 15, 2013
Messages
3,630
I agree. It's one of those things that was everywhere and nobody questioned it (and plenty of people messed around with these numbers).
I mean, in hindsight, it's totally ridiculous right? 90+% hits on the cache? What kind of cache, on the planet, gets 90+% hits for God's sake. And we had guys left and right who would double their RAM, then the cache hits would only go up 1-2%, and none of us, not you Eric, not me, not anyone, publicly questioned this or found it odd. "Oh man, your cache hits are only 84%, you need more RAM". And none of us paused, as "experts", to say, "hmmm. That's a pretty insane thing to say". I mean, we've all written caches for our own software things, and who the hell ever gets 90% hits on a cache for normal types of use cases. Ridiculous.

I'm embarrassed, actually, that none of us thought twice about this.
 

MrToddsFriends

Documentation Browser
Joined
Jan 12, 2015
Messages
1,338
This commit is at least part of the fix:
https://github.com/freenas/freenas/commit/baab2ecce52291a36b5c63fa7382f8a916be7918

Delayed execution of snapshots seems to be a side effect of this fix (sorry for not giving this pointer earlier here in this thread).
https://forums.freenas.org/index.ph...atio-dropped-significantly.48885/#post-335107

This very same commit was also identified as the root cause for bug #19754 (Updated to FreeNAS-9.10.2 and periodic snapshots no longer work) and got reverted
https://bugs.freenas.org/issues/19754
https://github.com/freenas/freenas/commit/79bd0e586281a7fbb1f0f6b95e4ddbd39a94cf5e

I'm expecting the old ARC Hit Ratios to come back in 9.10.2-U1.
 
Status
Not open for further replies.
Top