poor read speed, great write on raid10 6 disks

tngri

Dabbler
Joined
Jun 7, 2017
Messages
39
I'm doing some test with my 2xChelsion 320 connecte with short DAC sfp+ cable (no switch), to validate usage scenario (consolidate working files)

Truenas 12u5 <==> windows 10 pro, using smb share
My pool is like this

Code:
  pool: tank
 state: ONLINE
  scan: scrub repaired 0B in 05:21:56 with 0 errors on Sun Mar  8 05:21:57 2020
config:

        NAME                                            STATE     READ WRITE CKSUM
        tank                                            ONLINE       0     0     0
          mirror-0                                      ONLINE       0     0     0
            gptid/cdc1a35e-a93a-11e9-95a1-d05099c188d1  ONLINE       0     0     0
            gptid/cf82bc53-a93a-11e9-95a1-d05099c188d1  ONLINE       0     0     0
          mirror-1                                      ONLINE       0     0     0
            gptid/dd0fbcf3-a93a-11e9-95a1-d05099c188d1  ONLINE       0     0     0
            gptid/df012241-a93a-11e9-95a1-d05099c188d1  ONLINE       0     0     0
          mirror-2                                      ONLINE       0     0     0
            gptid/ec9e4ce9-a93a-11e9-95a1-d05099c188d1  ONLINE       0     0     0
            gptid/1996590b-42c8-11ea-87b4-d05099d3036a  ONLINE       0     0     0

errors: No known data errors


I don't understand why I only get this read performance on sequential read ....
what would be wrong ? never undestand how I can bench locally well the pool either ...
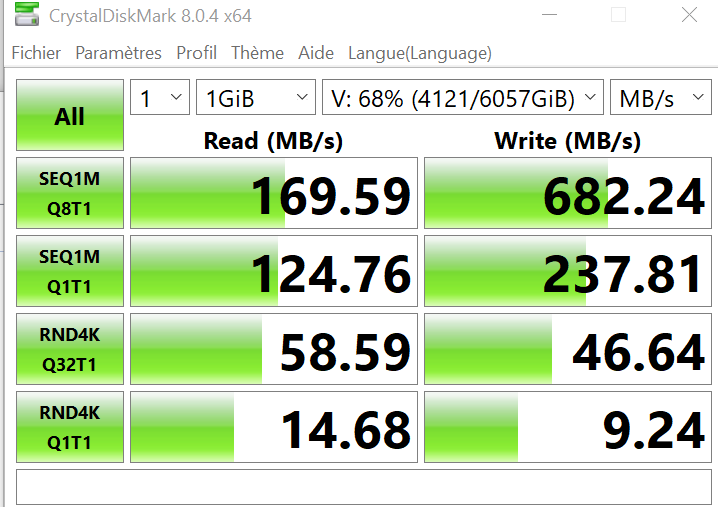
DiskMark64_eQlstmeCC8.png


Any advice would be appreciated :)
 

ChrisRJ

Wizard
Joined
Oct 23, 2020
Messages
1,919
Probably the write goes to cache, whereas the read comes from the disks. How often did you repeat that test?

Also, as per the forum rules, please provide your hardware details.
 

tngri

Dabbler
Joined
Jun 7, 2017
Messages
39
Probably the write goes to cache, whereas the read comes from the disks. How often did you repeat that test?
Also, as per the forum rules, please provide your hardware details.
sorry for the hardware : I use similar to freenas mini 1 : C2750D4I an atom 8-cores based mobo, with 32GB of RAM and wd red 6 x 3TB connected to mobo sata controller

160MB/s read out of cache ? that seems low even out of ARC, 3xstripes shoud five me 3xSingle Sata drive no ? (~300MB/s)

Thanks for caring
 
Last edited:

tngri

Dabbler
Joined
Jun 7, 2017
Messages
39

sretalla

Powered by Neutrality
Moderator
Joined
Jan 1, 2016
Messages
9,703
How did you construct the pool? Did you add all 3 VDEVs at the beginning before any content was added to the pool?
 

tngri

Dabbler
Joined
Jun 7, 2017
Messages
39
How did you construct the pool? Did you add all 3 VDEVs at the beginning before any content was added to the pool?
The Pool is "pure", 3 vdevs from the beginning ...


EDIT : I've checked disk usage, there all have similar i/o, busy values on acting ...

BUT something is wrong in dashboard, in fact I see that drives speed are all at max speed read/write around 16MB/28MB
maybe I have sata controller issue and didn't notice it before I tried the 10eth ...

OdnGXZ7Oa0.png
 
Last edited:

sretalla

Powered by Neutrality
Moderator
Joined
Jan 1, 2016
Messages
9,703
And with zpool list -v ? is the data evenly distributed?
 

tngri

Dabbler
Joined
Jun 7, 2017
Messages
39
And with zpool list -v ? is the data evenly distributed?

output:


Code:
NAME                                             SIZE  ALLOC   FREE  CKPOINT  EXPANDSZ   FRAG    CAP  DEDUP    HEALTH  ALTROOT
freenas-boot                                      14G  10.7G  3.28G        -         -      -    76%  1.00x    ONLINE  -
  da0p2                                           14G  10.7G  3.28G        -         -      -  76.6%      -    ONLINE
tank                                            8.16T  6.00T  2.15T        -         -    12%    73%  1.00x    ONLINE  /mnt
  mirror                                        2.72T  2.02T   713G        -         -    12%  74.4%      -    ONLINE
    gptid/cdc1a35e-a93a-11e9-95a1-d05099c188d1      -      -      -        -         -      -      -      -    ONLINE
    gptid/cf82bc53-a93a-11e9-95a1-d05099c188d1      -      -      -        -         -      -      -      -    ONLINE
  mirror                                        2.72T  1.99T   750G        -         -    12%  73.0%      -    ONLINE
    gptid/dd0fbcf3-a93a-11e9-95a1-d05099c188d1      -      -      -        -         -      -      -      -    ONLINE
    gptid/df012241-a93a-11e9-95a1-d05099c188d1      -      -      -        -         -      -      -      -    ONLINE
  mirror                                        2.72T  1.99T   742G        -         -    13%  73.3%      -    ONLINE
    gptid/ec9e4ce9-a93a-11e9-95a1-d05099c188d1      -      -      -        -         -      -      -      -    ONLINE
    gptid/1996590b-42c8-11ea-87b4-d05099d3036a      -      -      -        -         -      -      -      -    ONLINE
 

sretalla

Powered by Neutrality
Moderator
Joined
Jan 1, 2016
Messages
9,703
Based on that, your second and third mirrors may see more writes, so anything new written there and read back may not be at full speed of all 3 mirrors.

You're also well over 50% there...
 

tngri

Dabbler
Joined
Jun 7, 2017
Messages
39
Based on that, your second and third mirrors may see more writes, so anything new written there and read back may not be at full speed of all 3 mirrors.

You're also well over 50% there...
well, difference from ALLOC size between vdev .... what could it mean ? something I can to to "realign" (resilvering?) ?
I'm above 50% allocation but beyond recommended 80% : I don't use iSCSI for now

Getting 15/28MBsec per disk seems not normal right ?, I'm investigating on this
 

sretalla

Powered by Neutrality
Moderator
Joined
Jan 1, 2016
Messages
9,703
You're right that something isn't working as it should... if you're not looking for IOPS, then maybe your pool would have been better as RAIDZ2...
 

tngri

Dabbler
Joined
Jun 7, 2017
Messages
39
You're right that something isn't working as it should... if you're not looking for IOPS, then maybe your pool would have been better as RAIDZ2...
I plan to do iSCSI when I fix this issue and plan to get new bigger drives, but has my mobo can't get more than 32GB, not sure for now, that's with I've set to stripe of mirrors (testing performances)
 

sretalla

Powered by Neutrality
Moderator
Joined
Jan 1, 2016
Messages
9,703
difference from ALLOC size between vdev
ALLOC (allocated space, meaning written to/"used"), should be the inverse of Free (with a bit of overhead to make up any difference).

something I can to to "realign" (resilvering?) ?
There's not a lot that can be done other than re-writing the data... you can create a new dataset and move data to it, then removing the old one (and renaming it) and destroying snapshots to try to balance it better.

It's not too bad, but as you say, that's not going to get you back the "missing performance" anyway.
 

tngri

Dabbler
Joined
Jun 7, 2017
Messages
39
really don't know what to do to fix read issue with my drives ...
 

sretalla

Powered by Neutrality
Moderator
Joined
Jan 1, 2016
Messages
9,703
You should start with getting a benchmark with fio. As an example, this thread shows some examples of its use:

You can search around the forum for other performance tuning examples of using it if needed.
 

tngri

Dabbler
Joined
Jun 7, 2017
Messages
39
Some tests with dd

Code:
ant@mastodon:~ % dd if=/mnt/tank/testile of=/dev/null
dd: /mnt/tank/testile: No such file or directory
ant@mastodon:~ % dd if=/mnt/tank/home/testile of=/dev/null
3072000+0 records in
3072000+0 records out
1572864000 bytes transferred in 119.145060 secs (13201252 bytes/sec)


Code:
dd if=/dev/zero of=/mnt/tank/home/testile bs=500M count=3
3+0 records in
3+0 records out
1572864000 bytes transferred in 2.600227 secs (604894852 bytes/sec)


I search a lot in forum and google, nothing really helps

Interesting
disabling compression on /mnt/tank/home and deleting the testile from if then

Code:
dd if=/dev/zero of=/mnt/tank/home/testile bs=500M count=3
3+0 records in
3+0 records out
1572864000 bytes transferred in 2.120960 secs (741581182 bytes/sec)
ant@mastodon:~ % dd if=/mnt/tank/home/testile of=/dev/null
3072000+0 records in
3072000+0 records out
1572864000 bytes transferred in 30.607713 secs (51387832 bytes/sec)
ant@mastodon:~ % 


but still 80MB/s read on smb
 
Last edited:

sretalla

Powered by Neutrality
Moderator
Joined
Jan 1, 2016
Messages
9,703
Using /dev/zero isn't great unless you turned off compression since the zeros will be compressed greatly and the actual data written will be much smaller than the intended test.

You need to look into using a good sample file or making one that isn't all zeros.

use fio
 

Forza

Explorer
Joined
Apr 28, 2021
Messages
81
Some tests with dd

Code:
ant@mastodon:~ % dd if=/mnt/tank/testile of=/dev/null
dd: /mnt/tank/testile: No such file or directory
ant@mastodon:~ % dd if=/mnt/tank/home/testile of=/dev/null
3072000+0 records in
3072000+0 records out
1572864000 bytes transferred in 119.145060 secs (13201252 bytes/sec)


Code:
dd if=/dev/zero of=/mnt/tank/home/testile bs=500M count=3
3+0 records in
3+0 records out
1572864000 bytes transferred in 2.600227 secs (604894852 bytes/sec)


I search a lot in forum and google, nothing really helps

Interesting
disabling compression on /mnt/tank/home and deleting the testile from if then

Code:
dd if=/dev/zero of=/mnt/tank/home/testile bs=500M count=3
3+0 records in
3+0 records out
1572864000 bytes transferred in 2.120960 secs (741581182 bytes/sec)
ant@mastodon:~ % dd if=/mnt/tank/home/testile of=/dev/null
3072000+0 records in
3072000+0 records out
1572864000 bytes transferred in 30.607713 secs (51387832 bytes/sec)
ant@mastodon:~ %


but still 80MB/s read on smb
Are you doing dd onto a file over SMB? If so you'd loose lots of speed due to sync writes.
 

tngri

Dabbler
Joined
Jun 7, 2017
Messages
39
Are you doing dd onto a file over SMB? If so you'd loose lots of speed due to sync writes.
non /mnt/tank is my local pool, no network involved,
for the smb copy (using windows 10 explorer drag drop to windows desktop) it's smb but I thought smb was async by default and it's a reading operation from the zfs pool


I'll try to find a tdlr for fio, seems complicated tools
for now I just copy paste an example from a forum thread, and run run it from a dataset on the pool
not sure how to interprete the output

Code:
ant@mastodon:~ % fio --randrepeat=1 --ioengine=posixaio --direct=1 --gtod_reduce=1 --name=testing --filename=randreadwrite.fio --bs=4k --iodepth=64 --size=10G --rw=randrw
testing: (g=0): rw=randrw, bs=(R) 4096B-4096B, (W) 4096B-4096B, (T) 4096B-4096B, ioengine=posixaio, iodepth=64
fio-3.27
Starting 1 process
testing: Laying out IO file (1 file / 10240MiB)
Jobs: 1 (f=1): [m(1)][99.8%][r=20.3MiB/s,w=20.2MiB/s][r=5190,w=5172 IOPS][eta 00m:01s]
testing: (groupid=0, jobs=1): err= 0: pid=4627: Thu Sep  9 13:01:19 2021
  read: IOPS=2506, BW=9.79MiB/s (10.3MB/s)(5123MiB/523192msec)
   bw (  KiB/s): min= 5804, max=43992, per=100.00%, avg=10034.85, stdev=2798.74, samples=1042
   iops        : min= 1451, max=10998, avg=2508.39, stdev=699.70, samples=1042
  write: IOPS=2503, BW=9.78MiB/s (10.3MB/s)(5117MiB/523192msec); 0 zone resets
   bw (  KiB/s): min= 5764, max=43371, per=100.00%, avg=10022.36, stdev=2751.52, samples=1042
   iops        : min= 1441, max=10842, avg=2505.27, stdev=687.88, samples=1042
  cpu          : usr=5.51%, sys=16.39%, ctx=1832933, majf=1, minf=1
  IO depths    : 1=0.1%, 2=0.1%, 4=0.1%, 8=0.3%, 16=0.8%, 32=78.8%, >=64=20.0%
     submit    : 0=0.0%, 4=100.0%, 8=0.0%, 16=0.0%, 32=0.0%, 64=0.0%, >=64=0.0%
     complete  : 0=0.0%, 4=94.6%, 8=2.3%, 16=2.1%, 32=0.9%, 64=0.1%, >=64=0.0%
     issued rwts: total=1311533,1309907,0,0 short=0,0,0,0 dropped=0,0,0,0
     latency   : target=0, window=0, percentile=100.00%, depth=64

Run status group 0 (all jobs):
   READ: bw=9.79MiB/s (10.3MB/s), 9.79MiB/s-9.79MiB/s (10.3MB/s-10.3MB/s), io=5123MiB (5372MB), run=523192-523192msec
  WRITE: bw=9.78MiB/s (10.3MB/s), 9.78MiB/s-9.78MiB/s (10.3MB/s-10.3MB/s), io=5117MiB (5365MB), run=523192-523192msec
ant@mastodon:~ % ll

 
Last edited:
Top