
@freenas-supero I'm pretty sure this is a language issue. On an English forum, !!! is considered screaming. In fact any exclamation points directed towards someone trying to help you will be perceived poorly. If that is a genuine RANT and scream... my apologies, carry on. :)
-
Important Announcement for the TrueNAS Community.
The TrueNAS Community has now been moved. This forum has become READ-ONLY for historical purposes. Please feel free to join us on the new TrueNAS Community Forums
- Forums
- Archives
- FreeNAS (Legacy Software Releases)
- FreeNAS Help & support
- General Questions and Help
You are using an out of date browser. It may not display this or other websites correctly.
You should upgrade or use an alternative browser.
You should upgrade or use an alternative browser.
NFS dies under load
- Thread starter ideanatewi
- Start date
- Status
- Not open for further replies.
freenas-supero
Contributor
- Joined
- Jul 27, 2014
- Messages
- 128
Sorry for the triple !.. I am never screaming... I hate being screamed at so I never scream.
Im just too enthusiastic..
I am removing the triple exclamation marks right now. Yes this is a language issue, I mainly speak french and we use these to show our excitement rather than anger...
Sorry ;)
Im just too enthusiastic..
I am removing the triple exclamation marks right now. Yes this is a language issue, I mainly speak french and we use these to show our excitement rather than anger...
Sorry ;)
Ah, so yeah. that makes more sense. So no, you don't need all that hardware.
But, as for NFS dying under load, ESXi may be partly to blame. I don't know and I'm definitely out of ideas because there's far too many variables to easily identify the problem. Could be a driver problem on ESXi that is fubaring NFS connections. I don't know. :/
You're going to have to do process of elimination until you can narrow down the culprit. I'd start with mounting NFS shares on your desktop and see if those disconnect when the others do.
The number of possible causes is almost endless. Could be something silly, could be a misconfigured network switch, no way to know.
freenas-supero
Contributor
- Joined
- Jul 27, 2014
- Messages
- 128
Hey cyberjock,
I sense this is gonna be fun to troubleshoot... :) Right off the bat, I havent seen any of these kernel oops on any other machines.. I will keep an eye on the kernel output on the other unrelated physical clients but I doubt I will see anything interesting..
I have searched the freenas server for problems. Ran smart extended tests on ALL HDD's, all negative. Checked all logs and examined dmesg thoroughly, nothing...
Then did the same on the PVE node...
The only progress I made so far was to find the entries buried DEEP in /var/log/messages of the Centos VM.. According to what happened before the incident, it would have been while I was actively copying data TO the freenas server and zoneminder running on the centos VM was doing a cleanup of its event folder..
I genuinely thought the incident happened during a nightly rsync backup but no! Right under my nose at 17:52 monday!
I know this is not helping pinpoint the culprit but I will do more testing and report back... Perhaps a stress test on the freenas server is in order?
Not to bust your balls, but often when dealing with these kinds of issues the only solution is to put a ticket in with the hypervisor maker, the server maker, and the client VM OS and make each one rule itself out as the culprit. There's a ton of machinery going on in the background (as I'm sure you are aware) and, at the simplest level, those 3 machines need to be proven to not be the cause. ;)
freenas-supero
Contributor
- Joined
- Jul 27, 2014
- Messages
- 128
I may have narrowed down the issue to either the freenas server or the network...
This morning around 7am the same incident happened again. It seems that it is getting more frequent.
From the centos VM:
Oct 17 07:00:56 centos-productive kernel: INFO: task flush-0:19:30697 blocked for more than 120 seconds.
Oct 17 07:00:56 centos-productive kernel: Not tainted 2.6.32-431.29.2.el6.x86_64 #1
Oct 17 07:00:56 centos-productive kernel: "echo 0 > /proc/sys/kernel/hung_task_timeout_secs" disables this message.
Oct 17 07:00:56 centos-productive kernel: flush-0:19 D 0000000000000004 0 30697 2 0x00000080
Oct 17 07:00:56 centos-productive kernel: ffff8802c4287c00 0000000000000046 0000000000000000 0000000000000000
Oct 17 07:00:56 centos-productive kernel: ffff8802c4287ce0 ffffffff810598e4 ffff8802c4287c80 ffff8802c4287bf0
Oct 17 07:00:56 centos-productive kernel: ffff880a5bdac638 ffff8802c4287fd8 000000000000fbc8 ffff880a5bdac638
Oct 17 07:00:56 centos-productive kernel: Call Trace:
Oct 17 07:00:56 centos-productive kernel: [<ffffffff810598e4>] ? find_busiest_group+0x244/0x9e0
Oct 17 07:00:56 centos-productive kernel: [<ffffffff811a5860>] ? inode_wait+0x0/0x20
Oct 17 07:00:56 centos-productive kernel: [<ffffffff811a586e>] inode_wait+0xe/0x20
Oct 17 07:00:56 centos-productive kernel: [<ffffffff8152a0af>] __wait_on_bit+0x5f/0x90
Oct 17 07:00:56 centos-productive kernel: [<ffffffff811b4c88>] inode_wait_for_writeback+0x98/0xc0
Oct 17 07:00:56 centos-productive kernel: [<ffffffff8109b020>] ? wake_bit_function+0x0/0x50
Oct 17 07:00:56 centos-productive kernel: [<ffffffff811b61d5>] wb_writeback+0x205/0x410
Oct 17 07:00:56 centos-productive kernel: [<ffffffff81528e4e>] ? thread_return+0x4e/0x770
Oct 17 07:00:56 centos-productive kernel: [<ffffffff81084aa2>] ? del_timer_sync+0x22/0x30
Oct 17 07:00:56 centos-productive kernel: [<ffffffff811b6585>] wb_do_writeback+0x1a5/0x240
Oct 17 07:00:56 centos-productive kernel: [<ffffffff811b6683>] bdi_writeback_task+0x63/0x1b0
Oct 17 07:00:56 centos-productive kernel: [<ffffffff8109ae27>] ? bit_waitqueue+0x17/0xd0
Oct 17 07:00:56 centos-productive kernel: [<ffffffff81143700>] ? bdi_start_fn+0x0/0x100
Oct 17 07:00:56 centos-productive kernel: [<ffffffff81143786>] bdi_start_fn+0x86/0x100
Oct 17 07:00:56 centos-productive kernel: [<ffffffff81143700>] ? bdi_start_fn+0x0/0x100
Oct 17 07:00:56 centos-productive kernel: [<ffffffff8109abf6>] kthread+0x96/0xa0
Oct 17 07:00:56 centos-productive kernel: [<ffffffff8100c20a>] child_rip+0xa/0x20
Oct 17 07:00:56 centos-productive kernel: [<ffffffff8109ab60>] ? kthread+0x0/0xa0
Oct 17 07:00:56 centos-productive kernel: [<ffffffff8100c200>] ? child_rip+0x0/0x20
From the Proxmox node syslog:
Oct 17 07:18:58 proxmox pvestatd[3375]: WARNING: command 'df -P -B 1 /mnt/pve/backups' failed: got timeout
Oct 17 07:20:28 proxmox pvestatd[3375]: WARNING: command 'df -P -B 1 /mnt/pve/backups' failed: got timeout
Oct 17 07:21:08 proxmox pvestatd[3375]: WARNING: command 'df -P -B 1 /mnt/pve/backups' failed: got timeout
Oct 17 07:26:39 proxmox pvestatd[3375]: WARNING: command 'df -P -B 1 /mnt/pve/backups' failed: got timeout
Oct 17 07:28:48 proxmox pvestatd[3375]: WARNING: command 'df -P -B 1 /mnt/pve/backups' failed: got timeout
From another VM:
Oct 12 15:52:19 centos-ftp kernel: lockd: server 192.168.0.4 not responding, timed out
Oct 12 16:04:11 centos-ftp kernel: nfs: server 192.168.0.4 not responding, still trying
Oct 12 16:16:37 centos-ftp kernel: nfs: server 192.168.0.4 OK
Different dates and different times but all showing troubles to communicate with the freenas server..
I will look at the network switch then cabling, then the network cards, then I will start to think about a server malfunction on the freenas server...
solarisguy
Guru
- Joined
- Apr 4, 2014
- Messages
- 1,125
You may be having problems with the NFS server and/or your network. However, your CentOS on centos-productive should not be panicking! There should be only NFS messages like I quoted above from your centos-ftp machine.I may have narrowed down the issue to either the freenas server or the network... [...]
Oct 12 15:52:19 centos-ftp kernel: lockd: server 192.168.0.4 not responding, timed out
Oct 12 16:04:11 centos-ftp kernel: nfs: server 192.168.0.4 not responding, still trying
Oct 12 16:16:37 centos-ftp kernel: nfs: server 192.168.0.4 OK [...]
I will look at the network switch then cabling, then the network cards, then I will start to think about a server malfunction on the freenas server...
freenas-supero
Contributor
- Joined
- Jul 27, 2014
- Messages
- 128
cyberjock, your avatar has given me night terrors...:)
freenas-supero
Contributor
- Joined
- Jul 27, 2014
- Messages
- 128
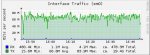
Update: I *may* have found the problem, or part of it. While I was using the Freenas server intensively for backups and other tasks, the system was slow so I decided to look at the system reports in the WebUI only to notice the speed graphs for the network cards to be rated up to 100Mbps while they should be up to 1Gbps...
The server motherboard has 3x gigabit adapters (as confirmed by Supermicro's website for the X7DBE+) and also by a pciconf -v on the freenas CLI:
em0@pci0:6:0:0: class=0x020000 card=0x109615d9 chip=0x10968086 rev=0x01 hdr=0x00
vendor = 'Intel Corporation'
device = '80003ES2LAN Gigabit Ethernet Controller (Copper)'
class = network
subclass = ethernet
em1@pci0:6:0:1: class=0x020000 card=0x109615d9 chip=0x10968086 rev=0x01 hdr=0x00
vendor = 'Intel Corporation'
device = '80003ES2LAN Gigabit Ethernet Controller (Copper)'
class = network
subclass = ethernet
em2@pci0:11:2:0: class=0x020000 card=0x107615d9 chip=0x10768086 rev=0x05 hdr=0x00
vendor = 'Intel Corporation'
device = '82541GI Gigabit Ethernet Controller'
class = network
subclass = ethernet
The reports graph is attached.
Do I need a special driver or to manually activate something?? The switch being used is a ProCurve 1800-24G (J9028B) and supports LACP, Gbps and other enterprise features so this shouldnt be the problem..
I will try doing a search on google once more for more clues but if someone has an idea please share.
Thanks!
Attachments
solarisguy
Guru
- Joined
- Apr 4, 2014
- Messages
- 1,125
@freenas-supero, on the switch, use LED Mode Select Button and please verify speed and duplex on ports connected to your NAS and to the client machine.
Or use web interface... If you have access to the switch web interface, please check received/transmitted errors on both ports too.
No VLANs ? The traffic is not going through some router connected 100FDX ? Etc.
Or use web interface... If you have access to the switch web interface, please check received/transmitted errors on both ports too.
No VLANs ? The traffic is not going through some router connected 100FDX ? Etc.
A bug in FreeBSD was recently fixed that relates to NFS not doing things right when multiple NFS clients were communicating over a ZFS dataset. It isn't clear that you are doing this, but you never know.
http://security.freebsd.org/advisories/FreeBSD-EN-14:12.zfs.asc
If you were serving VMs, you wouldn't usually run into the problem, because that doesn't involve multiple NFS clients looking at the same data.
http://security.freebsd.org/advisories/FreeBSD-EN-14:12.zfs.asc
If you were serving VMs, you wouldn't usually run into the problem, because that doesn't involve multiple NFS clients looking at the same data.
freenas-supero
Contributor
- Joined
- Jul 27, 2014
- Messages
- 128
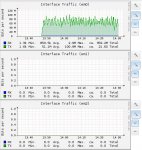
@solarisguy, I have checked the Procurve switch and saw no communication errors whatsoever but noticed that while all ports were configured for "auto" speed, in the status page, 3 out of 24 were reported as 100Mbps while the others were reported as 1000Mbps as they should. On the 3 ones reported as 100Mbps, 2 of them are connecting IPMI cards which I *believe* cant do Gigabit anyways (to be confirmed). The remaining 100Mbps port is the one that connects the freenas server to the network and acc. to the Supermicro site, the port should be Gigabit capable so is the switch...
Obviously I tried to manually set the port's speed to 1000Mbps in the switch's Web interface, and after a few seconds noticed that the speed in the "reports" page of freeNAS went up to 400Mbps...
So 2 questions:
1. Why is using Auto setting on the switch does not use native hardware capability? (in my case Gigabit)
2. I have plenty free ports on the switch, and another unused ports on the freenas server (the server has 4 ports, 2 onboard LAN, one IPMI card with a dedicated port and another LAN port that I believe is shareable...) Could I use something like LAGG to create redundant/additional communication channel between the switch and the freenas server? Would it help? Right now, 7 virtual machines are using the server for storage, while 3 physical clients are using it also for read/write intensive applications...
Also to answer you: No VLANs and the freenas server is directly connected to the procurve switch (so are the other machines).
@rs225, "when multiple NFS clients were communicating over a ZFS dataset" I strongly believe that this is what I am doing... On the dataset I created, I have several NFS mount points that I share with Linux VM's. I am not using freenas to store VM's.
PS: Sorry for the delay in responding to you guys
solarisguy
Guru
- Joined
- Apr 4, 2014
- Messages
- 1,125
The fact that you had to hardcode the switch port settings indicates that something is wrong:
Once your network is OK, you can start thinking about the next step.
- the cable
- physical port on the switch
- physical port on the motherboard
- software settings for the network port in the FreeNAS
Once your network is OK, you can start thinking about the next step.
freenas-supero
Contributor
- Joined
- Jul 27, 2014
- Messages
- 128
I am very sorry I have mis-identified the cables and it happened that the port that the freenas server is using on the procurve switch is set to 1000Mbps (auto).. The port I thought was 100Mbps is for the IPMI of the freenas server...
So I confirm:
-The switch port is set to "auto" and currently runs at Gbps
-The cable is working fine (and is Cat6)
-There were no errors on this port (according to the switch's logs)
-Freenas is reporting the adapter em0 as 1000bateT
em0: flags=8843<UP,BROADCAST,RUNNING,SIMPLEX,MULTICAST> metric 0 mtu 1500
options=4219b<RXCSUM,TXCSUM,VLAN_MTU,VLAN_HWTAGGING,VLAN_HWCSUM,TSO4,WOL_MAGIC,VLAN_HWTSO>
ether 00:30:48:7f:11:ba
inet 192.168.0.4 netmask 0xffffff00 broadcast 192.168.0.255
nd6 options=9<PERFORMNUD,IFDISABLED>
media: Ethernet autoselect (1000baseT <full-duplex>)
status: active
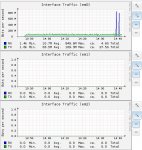
I did some tests (using dd on the client and netcat on the freenas server) and the results are quite interesting:
From all clients, the reported connection speed is 110MB/s (or 880Mbps) which is confirmed by the network graphs on the freenas Web interface.
So I am 99.9% confident that all networking is fine and properly setup, yet I am having terrible transfer speeds (transferring files right now at 7.5MB/s!!!) so I conclude that the ZFS dataset is the problem for the bad performances.
Network issues are IMO not to blame for the NFS lockups I reported earlier in this thread but maybe the ZFS bug reported by rs225 is to blame?
So I confirm:
-The switch port is set to "auto" and currently runs at Gbps
-The cable is working fine (and is Cat6)
-There were no errors on this port (according to the switch's logs)
-Freenas is reporting the adapter em0 as 1000bateT
em0: flags=8843<UP,BROADCAST,RUNNING,SIMPLEX,MULTICAST> metric 0 mtu 1500
options=4219b<RXCSUM,TXCSUM,VLAN_MTU,VLAN_HWTAGGING,VLAN_HWCSUM,TSO4,WOL_MAGIC,VLAN_HWTSO>
ether 00:30:48:7f:11:ba
inet 192.168.0.4 netmask 0xffffff00 broadcast 192.168.0.255
nd6 options=9<PERFORMNUD,IFDISABLED>
media: Ethernet autoselect (1000baseT <full-duplex>)
status: active
I did some tests (using dd on the client and netcat on the freenas server) and the results are quite interesting:
From all clients, the reported connection speed is 110MB/s (or 880Mbps) which is confirmed by the network graphs on the freenas Web interface.
So I am 99.9% confident that all networking is fine and properly setup, yet I am having terrible transfer speeds (transferring files right now at 7.5MB/s!!!) so I conclude that the ZFS dataset is the problem for the bad performances.
Network issues are IMO not to blame for the NFS lockups I reported earlier in this thread but maybe the ZFS bug reported by rs225 is to blame?
Attachments
- Status
- Not open for further replies.
Important Announcement for the TrueNAS Community.
The TrueNAS Community has now been moved. This forum will now become READ-ONLY for historical purposes. Please feel free to join us on the new TrueNAS Community Forums.Related topics on forums.truenas.com for thread: "NFS dies under load"
Similar threads
- Replies
- 14
- Views
- 7K
- Replies
- 5
- Views
- 5K
- Replies
- 2
- Views
- 3K