blckhm
Dabbler
- Joined
- Sep 24, 2018
- Messages
- 42
Hello everyone,
A few months ago, we transfered our all static contents to new freenas system which build on supermicro 6048.
Our specs are;
- Supermicro X10DRL-i
- Intel(R) Xeon(R) CPU E5-2630L v3 @ 1.80GHz
- DDR4 ECC 53207MB (cause we virtualized, actually 64gb)
- 10GbaseT network
- LSI3008 HBA
- 20x 8TB Seagate Archive HDD !!!BEWARE!!! SMR sucks! (we used only for backups)
- 4x 12TB WD Gold (serving static contents like jpeg, png, gif etc.)
+ 4 more 12TB drives on the way to expand the pool.
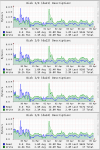
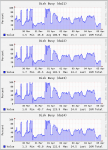
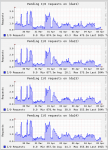
And our ZFS reports are;

When I read the charts, everything seems to be cached from ARC. And our hit ratio populated due Frequently Used pattern.
I think we don't need more memory capacity or any L2ARC under these loads, do I?
Our arc summary looks like that by the way;
A few months ago, we transfered our all static contents to new freenas system which build on supermicro 6048.
Our specs are;
- Supermicro X10DRL-i
- Intel(R) Xeon(R) CPU E5-2630L v3 @ 1.80GHz
- DDR4 ECC 53207MB (cause we virtualized, actually 64gb)
- 10GbaseT network
- LSI3008 HBA
- 20x 8TB Seagate Archive HDD !!!BEWARE!!! SMR sucks! (we used only for backups)
- 4x 12TB WD Gold (serving static contents like jpeg, png, gif etc.)
+ 4 more 12TB drives on the way to expand the pool.
And our ZFS reports are;

When I read the charts, everything seems to be cached from ARC. And our hit ratio populated due Frequently Used pattern.
I think we don't need more memory capacity or any L2ARC under these loads, do I?
Our arc summary looks like that by the way;
Code:
System Memory:

    0.03%    15.95    MiB Active,    1.56%    809.18    MiB Inact
    95.59%    48.41    GiB Wired,    0.00%    0    Bytes Cache
    2.15%    1.09    GiB Free,    0.67%    346.41    MiB Gap

    Real Installed:                56.00    GiB
    Real Available:            92.79%    51.96    GiB
    Real Managed:            97.46%    50.64    GiB

    Logical Total:                56.00    GiB
    Logical Used:            96.65%    54.12    GiB
    Logical Free:            3.35%    1.88    GiB

Kernel Memory:                    3.96    GiB
    Data:                99.05%    3.92    GiB
    Text:                0.95%    38.67    MiB

Kernel Memory Map:                50.64    GiB
    Size:                22.08%    11.18    GiB
    Free:                77.92%    39.46    GiB
                                Page:  1
------------------------------------------------------------------------

ARC Summary: (HEALTHY)
    Storage pool Version:            5000
    Filesystem Version:            5
    Memory Throttle Count:            0

ARC Misc:
    Deleted:                12.83m
    Mutex Misses:                2.66k
    Evict Skips:                2.66k

ARC Size:                77.78%    38.61    GiB
    Target Size: (Adaptive)        77.73%    38.59    GiB
    Min Size (Hard Limit):        12.50%    6.21    GiB
    Max Size (High Water):        8:1    49.64    GiB

ARC Size Breakdown:
    Recently Used Cache Size:    40.78%    15.75    GiB
    Frequently Used Cache Size:    59.22%    22.87    GiB

ARC Hash Breakdown:
    Elements Max:                2.36m
    Elements Current:        72.84%    1.72m
    Collisions:                4.58m
    Chain Max:                6
    Chains:                    154.29k
                                Page:  2
------------------------------------------------------------------------

ARC Total accesses:                    833.83m
    Cache Hit Ratio:        97.58%    813.62m
    Cache Miss Ratio:        2.42%    20.21m
    Actual Hit Ratio:        97.54%    813.30m

    Data Demand Efficiency:        82.23%    13.89m
    Data Prefetch Efficiency:    16.98%    7.32m

    CACHE HITS BY CACHE LIST:
      Most Recently Used:        3.12%    25.37m
      Most Frequently Used:        96.84%    787.93m
      Most Recently Used Ghost:    0.19%    1.52m
      Most Frequently Used Ghost:    0.07%    609.25k

    CACHE HITS BY DATA TYPE:
      Demand Data:            1.40%    11.42m
      Prefetch Data:        0.15%    1.24m
      Demand Metadata:        98.44%    800.91m
      Prefetch Metadata:        0.01%    42.24k

    CACHE MISSES BY DATA TYPE:
      Demand Data:            12.22%    2.47m
      Prefetch Data:        30.07%    6.08m
      Demand Metadata:        46.97%    9.49m
      Prefetch Metadata:        10.75%    2.17m
                                Page:  3
------------------------------------------------------------------------

                                Page:  4
------------------------------------------------------------------------

DMU Prefetch Efficiency:            200.34m
    Hit Ratio:            5.03%    10.07m
    Miss Ratio:            94.97%    190.27m

                                Page:  5
------------------------------------------------------------------------
Last edited:


