David Dyer-Bennet
Patron
- Joined
- Jul 13, 2013
- Messages
- 286
I've got a running scrub in one of the servers which has been down for some maintenance last night and today; there are no other users, just the scrub.
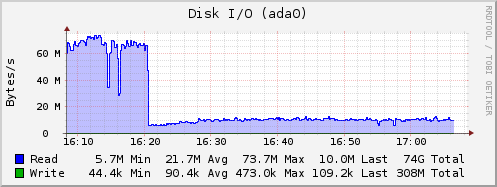
I'm seeing disk traffic like this (identical on all 7 drives):

That's all during the scrub, and nothing else is going on.
Pool state is:
So why do I see such a huge change in disk throughput during the scrub? Feels weird, plus of course it makes the estimate of time to completion go crazy (it was showing less than 8 hours to completion last I looked, now it's showing 24!)
(I don't really expect to find anything I can do about it, I'm just curious, I like to understand how stuff I'm using works.)
I'm seeing disk traffic like this (identical on all 7 drives):
That's all during the scrub, and nothing else is going on.
Pool state is:
Code:
[ddb@zzbackup ~]$ zpool list
NAME  SIZE  ALLOC  FREE  EXPANDSZ  FRAG  CAP  DEDUP  HEALTH  ALTROOT
zzback  38T  24.5T  13.5T  -  28%  64%  1.00x  ONLINE  /mnt

[ddb@zzbackup ~]$ zpool status zzback
  pool: zzback
state: ONLINE
  scan: scrub in progress since Tue May 10 04:00:04 2016
        8.36T scanned out of 24.5T at 190M/s, 24h44m to go
        0 repaired, 34.10% done
config:

        NAME                                            STATE     READ WRITE CKSUM
        zzback                                          ONLINE       0     0     0
          raidz2-0                                      ONLINE       0     0     0
            gptid/e2f6c2c1-af82-11e5-9d15-20cf306269eb  ONLINE       0     0     0
            gptid/e41790b8-af82-11e5-9d15-20cf306269eb  ONLINE       0     0     0
            gptid/e4fa168f-af82-11e5-9d15-20cf306269eb  ONLINE       0     0     0
            gptid/e5d2abce-af82-11e5-9d15-20cf306269eb  ONLINE       0     0     0
            gptid/e6b31a5f-af82-11e5-9d15-20cf306269eb  ONLINE       0     0     0
            gptid/e78826c7-af82-11e5-9d15-20cf306269eb  ONLINE       0     0     0
            gptid/ec3dad61-af82-11e5-9d15-20cf306269eb  ONLINE       0     0     0

errors: No known data errors
So why do I see such a huge change in disk throughput during the scrub? Feels weird, plus of course it makes the estimate of time to completion go crazy (it was showing less than 8 hours to completion last I looked, now it's showing 24!)
(I don't really expect to find anything I can do about it, I'm just curious, I like to understand how stuff I'm using works.)
