Hi all,
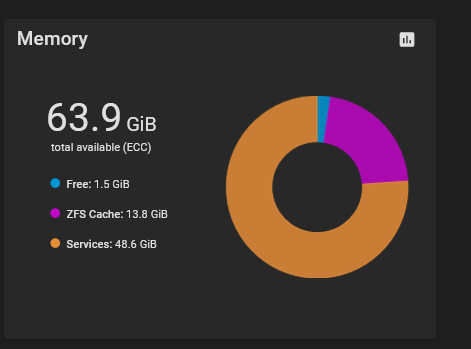
I noticed today that my Services memory usage on the dashboard is unusually high - around 50GB.

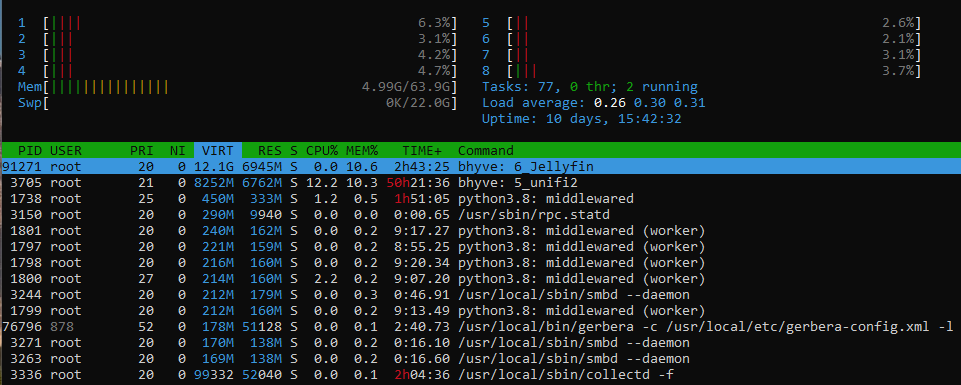
So I popped open htop to see what was going on and nothing correlates. Then I noticed that the actual Services reserved memory usage is almost exaclty 13.8GB (which is shown as the 'ZFS Cache' on the dashboard). So it would seem what has happened is that the metrics on the dashboard have somehow got switched!

Anyone else seen this?
I noticed today that my Services memory usage on the dashboard is unusually high - around 50GB.
So I popped open htop to see what was going on and nothing correlates. Then I noticed that the actual Services reserved memory usage is almost exaclty 13.8GB (which is shown as the 'ZFS Cache' on the dashboard). So it would seem what has happened is that the metrics on the dashboard have somehow got switched!
Anyone else seen this?
