Trying to understand ZFS ARC and L2ARC stats.

mpyusko

Dabbler
Joined
Jul 5, 2019
Messages
49
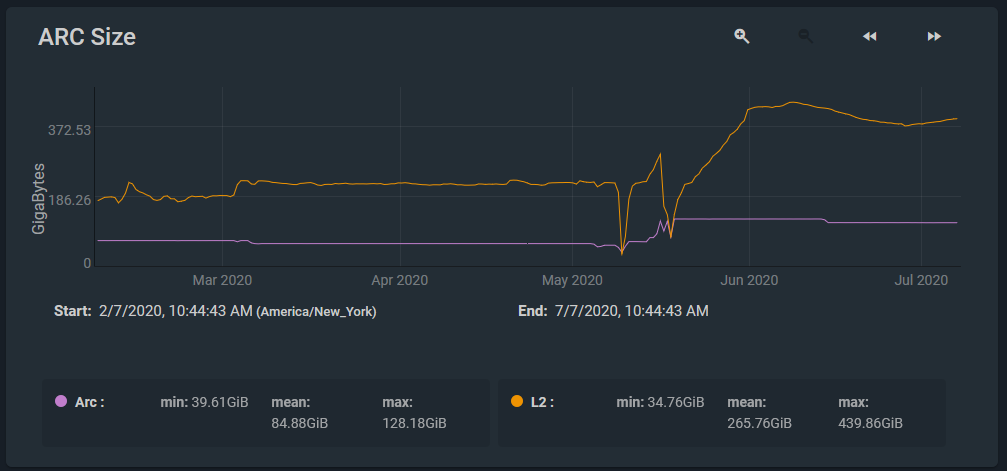
From this graph you can see the evolution of my ARC and L2ARC sizes. Initially I had 96GB RAM and then upped it to 160 in mid-May. Then I swapped out the 250 GB SSD and put in a 500GB.
1594133523082.png

As you can see, it grew rapidly for a couple weeks, until June. Then it peaked and seems to have declined a little. (The low-point near the beginning of July is 118 GB and 376 GB.)

Very simply, why would I see this?
Would this essentially indicated I have a properly sized ARC and L2ARC for my array?

1594134139189.png

1594134160334.png
 

MikeyG

Patron
Joined
Dec 8, 2017
Messages
442
What's your ARC target size when you run arc_summary.py? I have a similar question. I have 192GB, hosting multiple VMs and regularly transferring large files, yet my target size is 122GB, and it stays at that number through weeks of uptime even though max size is 185GB.

I assume there's a usage pattern that would cause target size to grow again, but I don't know what it would be.

I have noticed that on reboot, target and max size are the same, then some process kicks in as soon as max size is reached which rapidly re-adjusts the target size downwards.
 

mpyusko

Dabbler
Joined
Jul 5, 2019
Messages
49
What's your ARC target size when you run arc_summary.py? I have a similar question. I have 192GB, hosting multiple VMs and regularly transferring large files, yet my target size is 122GB, and it stays at that number through weeks of uptime even though max size is 185GB.

I reserve 16 GB for 2 VMs that run under BHYVE. The rest of the VMs run off Xen Hypervisors.
 

MikeyG

Patron
Joined
Dec 8, 2017
Messages
442
Sorry, I meant that my NAS servers VMs via iSCSI targets, not hosting them directly so no memory usage for them. Would be interesting to know your ARC target size vs actual current size which I can't tell from the screenshots you posted.
 

mpyusko

Dabbler
Joined
Jul 5, 2019
Messages
49
Code:
System Memory:

        0.69%   1.07    GiB Active,     7.65%   11.93   GiB Inact
        87.49%  136.42  GiB Wired,      0.00%   0       Bytes Cache
        2.37%   3.70    GiB Free,       1.79%   2.79    GiB Gap

        Real Installed:                         160.00  GiB
        Real Available:                 99.97%  159.94  GiB
        Real Managed:                   97.48%  155.92  GiB

        Logical Total:                          160.00  GiB
        Logical Used:                   90.23%  144.37  GiB
        Logical Free:                   9.77%   15.63   GiB

Kernel Memory:                                  1.85    GiB
        Data:                           97.58%  1.81    GiB
        Text:                           2.42%   45.94   MiB

Kernel Memory Map:                              155.92  GiB
        Size:                           4.55%   7.10    GiB
        Free:                           95.45%  148.82  GiB
                                                                Page:  1
------------------------------------------------------------------------

ARC Summary: (HEALTHY)
        Storage pool Version:                   5000
        Filesystem Version:                     5
        Memory Throttle Count:                  0

ARC Misc:
        Deleted:                                51.69m
        Mutex Misses:                           45.49k
        Evict Skips:                            45.49k

ARC Size:                               92.22%  118.00  GiB
        Target Size: (Adaptive)         92.19%  117.96  GiB
        Min Size (Hard Limit):          15.13%  19.36   GiB
        Max Size (High Water):          6:1     127.95  GiB

ARC Size Breakdown:
        Recently Used Cache Size:       13.18%  15.56   GiB
        Frequently Used Cache Size:     86.82%  102.44  GiB

ARC Hash Breakdown:
        Elements Max:                           7.86m
        Elements Current:               57.07%  4.48m
        Collisions:                             47.93m
        Chain Max:                              6
        Chains:                                 274.00k
                                                                Page:  2
------------------------------------------------------------------------

Code:
L2 ARC Summary: (HEALTHY)
        Passed Headroom:                        13.10m
        Tried Lock Failures:                    296.68k
        IO In Progress:                         1
        Low Memory Aborts:                      19
        Free on Write:                          2.32k
        Writes While Full:                      106.08k
        R/W Clashes:                            0
        Bad Checksums:                          0
        IO Errors:                              0
        SPA Mismatch:                           3.02b

L2 ARC Size: (Adaptive)                         451.39  GiB
        Compressed:                     87.67%  395.72  GiB
        Header Size:                    0.03%   155.93  MiB

L2 ARC Evicts:
        Lock Retries:                           804
        Upon Reading:                           0

L2 ARC Breakdown:                               90.20m
        Hit Ratio:                      51.34%  46.31m
        Miss Ratio:                     48.66%  43.89m
        Feeds:                                  4.35m

L2 ARC Buffer:
        Bytes Scanned:                          546.72  TiB
        Buffer Iterations:                      4.35m
        List Iterations:                        17.37m
        NULL List Iterations:                   3.19k

L2 ARC Writes:
        Writes Sent:                    100.00% 853.93k
                                                                Page:  4
------------------------------------------------------------------------
 

MikeyG

Patron
Joined
Dec 8, 2017
Messages
442
For ARC that seems pretty good to me. You are at 92% of Max size, and considering you are allocating 16GB to VMs, Max of 128GB isn't unreasonable. For me I'm at 65%.

For L2ARC, if you are at 450 out of 500GB that would also seem normal. 500GB of L2ARC is a pretty decent amount, so might not get maxed out unless your usage was sufficient.
 

sretalla

Powered by Neutrality
Moderator
Joined
Jan 1, 2016
Messages
9,703
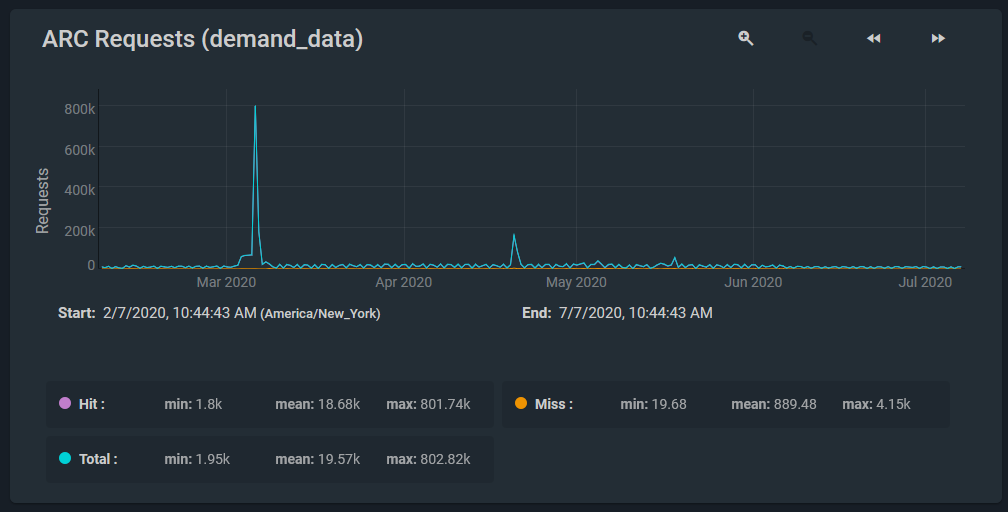
You were already not showing a very high proportion of ARC misses before adding the RAM (highest rate of misses was just over 4K, with hits peaking at 801K)

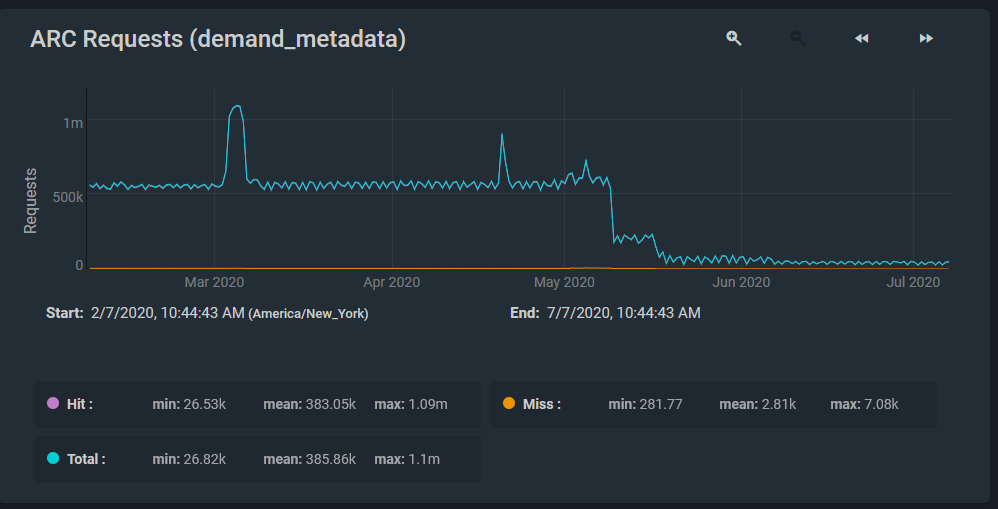
It looks to me like your ARC metadata hits were also almost 100% of the time before adding the RAM... although in early May, I can see a period of misses there in the chart, but still basically none compared to the hits.

For some reason, it seems that you have far fewer requests for metadata from ARC now... maybe more metadata is just in system RAM? (maybe somebody with more deep platform knowledge can explain that one)

I found this presentation useful in understanding the benefit (or not) of L2ARC...

L2ARC does have a cost and it may not always outweigh the payback.
 
Top