What does this process actually do? Are there any logs that I can provide to assist?
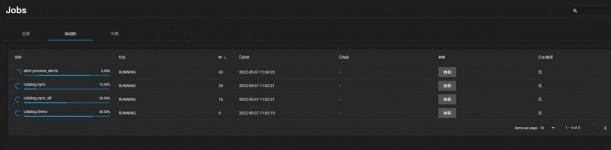
Middlewared seems to handle a variety of background services (
https://github.com/truenas/middleware) -- from loading/updating app catalogs to providing real-time stats data for the dashboard. At this point there are multiple posts in this forum, on Reddit, and in JIRA regarding middlewared/asyncio_loop consuming both increased cpu and/or memory over time. People point at both app catalog processing (like this post) and Web UI interaction (like this
other post) as potential causes.
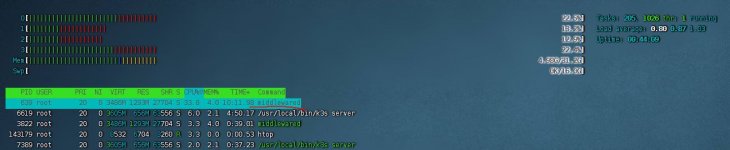
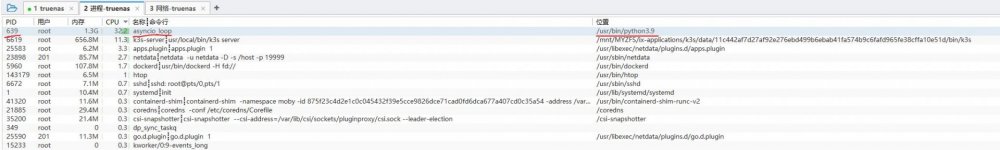
Personally I see middlewared's async process memory swelling (not not being reclaimed later) just sitting on the UI dashboard page, where a WebSocket is streaming realtime stats data from middlewared. Browsing away from the dashboard I see middleware memory growth slow or stop 90+% of the time (as the data subscription should stop). Although sometimes it doesn't seem to, as if a processes that should have been stopped wasn't, and has entered a tight(er) loop. (Which I see as a step up in background cpu that stays around, along with memory use). Restarting middlewared drops memory and cpu, effectively starting things over without a full reboot.
So I think it's going to take some investigation by IX to get at the root cause(s). But from what I've seen, if I had to *
guess*, I'd say there is some issue related to Websocket data data handling/caching which shows up most on pages like the dashboard where there is more data being being sent (via "reporting.realtime"). Total guess though. :)

 www.reddit.com