strange RAM usage

Dunuin

Contributor
Joined
Mar 7, 2013
Messages
110
Hi,

Since updating from 11.3 to 12.0 I see strange RAM usage. Most of the time services are using 10-12 of 32GB RAM. But sometimes the services are going up to 30GB. It stays there for a while and after some hours it might go down to 10-12GB again. Then there is alot of free RAM because the ARC got shunk down to 1GB and over time the ARC is growing to 19-21 GB again.

What could cause this? I thought there might be a memery leak or something like that but with memory leaks the service size should stay high right?

truenas.png


This is the output of "top -o res" while services are using 29.6GiB:
Code:
last pid: 39792;  load averages:  0.58,  0.49,  0.48    up 5+23:13:41  21:42:40
104 processes: 1 running, 103 sleeping
CPU:  1.8% user,  0.0% nice,  1.3% system,  0.1% interrupt, 96.8% idle
Mem: 626M Active, 6674M Inact, 980K Laundry, 23G Wired, 740M Free
ARC: 1626M Total, 418M MFU, 585M MRU, 15M Anon, 52M Header, 556M Other
     297M Compressed, 967M Uncompressed, 3.25:1 Ratio
Swap: 6144M Total, 6144M Free

PID USERNAME    THR PRI NICE   SIZE    RES STATE    C   TIME    WCPU COMMAND
4380 root         45  20    0  3159M  1915M kqread   3 393:15   2.05% bhyve
4257 root         40  20    0  1087M   766M kqread   3 592:32   4.86% bhyve
  369 root         45  23    0   620M   492M kqread   0 112:07   0.03% python3.9
2009 root          4  30    0   465M   453M select   5 457:40   0.00% python3.9
4625 root          1  20    0   481M   438M kqread   2  38:20   0.00% smbd
4352 root         29  20    0   561M   433M kqread   7 237:40   1.50% bhyve
85591 root          1  20    0   246M   217M kqread   2   0:00   0.00% smbd
16670 root          1  20    0   256M   216M kqread   4  87:43   0.00% smbd
87437 root          1  20    0   261M   214M kqread   6  55:38   0.00% smbd
35272 root          1  20    0   248M   209M kqread   0   0:25   0.00% smbd
35271 root          1  20    0   247M   208M kqread   4   0:01   0.00% smbd
35277 root          1  20    0   248M   208M kqread   6   0:01   0.00% smbd
35274 root          1  20    0   247M   208M kqread   0   0:01   0.00% smbd
35270 root          1  20    0   246M   207M kqread   4   0:00   0.00% smbd
35275 root          1  20    0   246M   207M kqread   3   0:01   0.00% smbd

So I can't see what should use that much RAM. The 3 bhye processes are my 3 VMs. They got 3GB+1GB+512MB RAM so that looks normal.
I'm running no jails and my enabled services are FTP, NFS, Rsync, SMART, SMB, SNMP, SSH and UPS. If I disable all services while services are maxing out the RAM it doens't lower the RAM usage.

I'm running TrueNAS Core 12.0U4.1 on a Supermicro X10SLL-F + 32GB ECC RAM + Xeon E3-1230v3.

Any ideas?

Edit:
"arc_summary" also shows me that the ARC is shrunken down to 1.6 GiB so that RAM usage is not just a widget display error. So what is eating all that RAM? Are there some commands other than "top" I can run to see what is using that RAM?

Edit:
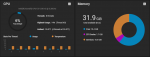
Now its freed up again without me doing anything:
truenas2.png


Top sorted by res:
Code:
last pid: 46223;  load averages:  0.70,  0.53,  0.45                                                                                                                                                                 up 6+00:13:19  22:42:18
101 processes: 1 running, 100 sleeping
CPU:  1.3% user,  0.0% nice,  1.4% system,  0.1% interrupt, 97.2% idle
Mem: 648M Active, 6670M Inact, 968K Laundry, 4679M Wired, 19G Free
ARC: 1769M Total, 436M MFU, 707M MRU, 17M Anon, 53M Header, 557M Other
     348M Compressed, 1044M Uncompressed, 2.99:1 Ratio
Swap: 6144M Total, 6144M Free

  PID USERNAME    THR PRI NICE   SIZE    RES STATE    C   TIME    WCPU COMMAND
 4380 root         45  20    0  3159M  1916M kqread   0 396:29   4.18% bhyve
 4257 root         40  20    0  1087M   766M kqread   6 597:25   4.56% bhyve
  369 root         42  20    0   654M   512M kqread   1 113:12   0.83% python3.9
 2009 root          4  31    0   467M   455M select   4 460:58   0.39% python3.9
 4625 root          1  20    0   482M   439M kqread   1  38:29   0.00% smbd
 4352 root         29  20    0   561M   433M kqread   5 239:36   2.33% bhyve
16670 root          1  20    0   256M   218M kqread   1  87:44   0.00% smbd
85591 root          1  20    0   246M   218M kqread   4   0:00   0.00% smbd
87437 root          1  20    0   261M   214M kqread   2  55:38   0.00% smbd
35272 root          1  20    0   248M   209M kqread   0   0:25   0.00% smbd
35271 root          1  20    0   247M   208M kqread   4   0:01   0.00% smbd
35277 root          1  20    0   248M   208M kqread   7   0:01   0.00% smbd
35274 root          1  20    0   247M   208M kqread   2   0:01   0.00% smbd
35270 root          1  20    0   246M   207M kqread   3   0:00   0.00% smbd
35275 root          1  20    0   246M   207M kqread   5   0:01   0.00% smbd


And diagrams:
truenas3.png

truenas5.png
 

Attachments

  • truenas2.png
    truenas2.png
    42 KB · Views: 232
  • truenas3.png
    truenas3.png
    69 KB · Views: 208
  • truenas4.png
    truenas4.png
    54.9 KB · Views: 174
  • truenas5.png
    truenas5.png
    78.9 KB · Views: 184
Last edited:

olddog9

Dabbler
Joined
Apr 23, 2021
Messages
28
Questions for you:

1- Are you running 'cron' jobs and if so, what do they do periodically ?
2 - Swap size seem larger than you may need. Any reason swap size is 6 GB with 32 GB RAM ?
On my TrueNAS 12.2 U4.1 with 64 GB RAM; swap is 4GB (4096M).
3 - At the command line ...Shell ... see if you can identify processes starting or stopping, as memory use drastically changes.
There are many tools to monitor the system. Try this command: dwatch execve
4 - Briefly describe the 3 bhyve based VMs (operating system type, running java vm?).
What TYPE of virtual network interface (tap, vnet, vale) configured for each virtual machine?
 

olddog9

Dabbler
Joined
Apr 23, 2021
Messages
28
This may be an ARC issue. Please read the post below ... about 'excess' RAM memory being used for other caching purposes.

https://www.truenas.com/community/threads/understanding-memory-usage.62433/page-2#post-446545

"The thing that is happening here is that the ARC (Adaptive Replacement Cache) is filling up RAM and when the system has something happen that makes it need some more memory, it needs to swap something out.
Earlier in this thread, I commented about not seeing any swap usage on my system and I figured out the reason for that. It isn't down to the amount of RAM you have or what processes you are running, it is down to how the default system is tuned to limit the size of the ARC. There are tunables (http://doc.freenas.org/11/system.html?highlight=tunabl#tunables) that can be set to manage how much RAM can be used for ARC and I set some of those a long time ago and have been carrying that configuration forward for so many years I forgot that I had done it.
I set a tunable called vfs.zfs.arc_max which you can find out more about here:
https://forums.freenas.org/index.php?threads/vfs-zfs-arc_max-has-immediate-effect.55768/
In the thread pointed out by @MrToddsFriends , above, they discuss what looks like a better way to do it.
"
 

Dunuin

Contributor
Joined
Mar 7, 2013
Messages
110
1- Are you running 'cron' jobs and if so, what do they do periodically ?

There are only 2 Crons:
1.) A script that I wrote myself that will bootup and unlock the Backup TrueNAS server. Then it uses the API to wait until all replications and scrubs are finished and shut the backup TrueNAS server down again. It runs every saturday at 11:45 PM. (45 23 * * sat)
2.) A script that I wrote that crontrols the fans using ipmitool It will run one every hour (0 * * * * ), and check if the script is already running. If it is running (pid and lock file check) it will just quit, if not it will continue forever and monitor/control the fans every 5 seconds. This script is also started once as POSTINIT script.
Then there are scrubs ("0 0 * * sun" with 35 days threshold), periodic snapshot tasks ("0 0 * * sun" and "0 0 * * mon,tue,wed,thu,fri,sat") and replication tasks that run when the snapshots are running.

2 - Swap size seem larger than you may need. Any reason swap size is 6 GB with 32 GB RAM ?
On my TrueNAS 12.2 U4.1 with 64 GB RAM; swap is 4GB (4096M).
That are the default 2GB Swap per drive that FreeNAS created.

3 - At the command line ...Shell ... see if you can identify processes starting or stopping, as memory use drastically changes.
There are many tools to monitor the system. Try this command: dwatch execve
Thanks. Didn't know that command. Piped it to a logfile to be able to compare it to the memory usage graphs later.

4 - Briefly describe the 3 bhyve based VMs (operating system type, running java vm?).
What TYPE of virtual network interface (tap, vnet, vale) configured for each virtual machine?
VM1 is a Debian 10 with Proxmox Backup Server:
3GiB RAM, 4 Cores, UEFI, CD-ROm, VNC, Disk for Swap (VirtIO, 4096 sector size, zvol with 4G volsize and 16K volblocksize, no thin), Disk for root (VirtIO, 4096 sector size, zvol with 32G volsize and 16K volblocksize, thin), NIC (virtio attached to VLAN49), NIC (virtio attached to bridge43)

VM2 is Debian 10 with Pi-hole:
512MiB RAM, 1 Core, UEFI, CDROM, VNC, Disk for Swap (VirtIO, 4096 sector size, zvol with 2G volsize and 64K volblocksize, no thin), Disk for root (VirtIO, 4096 sector size, zvol with 16G volsize and 64K volblocksize, thin), NIC (virtio attached to bridge42)

VM3 is OPNsense:
1GiB RAM, 4 cores, UEFI, CD-ROM, VNC, Disk for Swap (VirtIO, 4096 sector size, zvol with 4G volsize and 64K volblocksize, no thin), Disk for root (VirtIO, 4096 sector size, zvol with 32G volsize and 64K volblocksize, thin) and 9x virtio NICs attached to bridge2, bridge4, bridge41, bridge43, bridge43, bridge44, bridge46, bridge47, bridge50.

The network looks like this:

mlxen0 (ConnectX3 10Gbit, 9000 MTU):
-> vlan45 (parent: mlxen0, 9000 MTU, VLAN Tag 45, IP: 192.168.45.4/24)
-> vlan48 (parent: mlxen0, 9000 MTU, VLAN Tag 48, IP: 192.168.48.4/24)
-> vlan49 (parent: mlxen0, 9000 MTU, VLAN Tag 49, IP: 192.168.49.4/24)
-> vlan51 (parent: mlxen0, 9000 MTU, VLAN Tag 51, IP: 192.168.51.4/24)

em0 (Intel 1Gbit, 1500 MTU):
-> bridge4 (parent: em0, 1500 MTU, no VLAN, no IP)

igb0 (Intel 1Gbit, 1500 MTU):
-> vlan2 (parent: igb0, 1500 MTU, VLAN Tag 2, no IP)
----> bridge2 (parent: vlan2, no MTU, no VLAN Tag, no IP)
-> vlan41 (parent: igb0, 1500 MTU, VLAN Tag 41, IP: 192.168.41.4/24)
----> bridge41 (parent: vlan41, no MTU, no VLAN Tag, no IP)
-> vlan42 (parent: igb0, 1500 MTU, VLAN Tag 42, IP: 192.168.42.9/24)
----> bridge42 (parent: vlan42, no MTU, no VLAN Tag, no IP)
-> vlan43 (parent: igb0, 1500 MTU, VLAN Tag 43, IP: 192.168.43.10/24)
----> bridge43 (parent: vlan43, no MTU, no VLAN Tag, no IP)
-> vlan44 (parent: igb0, 1500 MTU, VLAN Tag 44, no IP)
----> bridge44 (parent: vlan44, no MTU, no VLAN Tag, no IP)
-> vlan46 (parent: igb0, 1500 MTU, VLAN Tag 46, no IP)
----> bridge46 (parent: vlan46, no MTU, no VLAN Tag, no IP)
-> vlan47 (parent: igb0, 1500 MTU, VLAN Tag 47, no IP)
----> bridge47 (parent: vlan47, no MTU, no VLAN Tag, no IP)
-> vlan50 (parent: igb0, 1500 MTU, VLAN Tag 50, no IP)
----> bridge50 (parent: vlan50, 1500 MTU, no VLAN Tag, no IP)

SMB is listening on 192.168.43.10/24, 192.168.45.4/24, 192.168.48.4/24, 192.168.49.4/24 and 192.168.51.4/24.
NFS is listening on 192.168.45.4/24 and 192.168.49.4/24.
Rsync is listening on all IPs.
FTP is listening on 192.168.41.4/24.
SSH is listening on 192.168.43.10/24.
WebUI is listening on 192.168.43.10/24.


Not sure why the one NIC of the Proxmox Backup Server VM is attached to VLAN49 or why that is working at all. I wonder why I didn't create a "bridge49" for it and attached it to that. Isn't it required that a virtio NIC is attached to a bridge? Atleast on Linux I thought that is required.
By the way...is it valid to assign a IP to the vlan interface? Shouldn't that IP be assigned to the bridge instead?


This may be an ARC issue. Please read the post below ... about 'excess' RAM memory being used for other caching purposes.
I didn't changed any ZFS options. ARC limits should be default. These are my ARC tunables reported by arc_summary:
Code:
arc.average_blocksize                                       8192
        arc.dnode_limit                                                0
        arc.dnode_limit_percent                                       10
        arc.dnode_reduce_percent                                      10
        arc.evict_batch_limit                                         10
        arc.eviction_pct                                             200
        arc.grow_retry                                                 0
        arc.lotsfree_percent                                          10
        arc.max                                                        0
        arc.meta_adjust_restarts                                    4096
        arc.meta_limit                                                 0
        arc.meta_limit_percent                                        75
        arc.meta_min                                                   0
        arc.meta_prune                                             10000
        arc.meta_strategy                                              1
        arc.min                                                        0
        arc.min_prefetch_ms                                            0
        arc.min_prescient_prefetch_ms                                  0
        arc.p_dampener_disable                                         1
        arc.p_min_shift                                                0
        arc.pc_percent                                                 0
        arc.shrink_shift                                               0
        arc.sys_free                                                   0
        arc_free_target                                           173746
        arc_max                                                        0
        arc_min                                                        0
        arc_no_grow_shift                                              5
 

Dunuin

Contributor
Joined
Mar 7, 2013
Messages
110
Services gone up from 12 to 21GB. Anything in the log that could have caused this?

Edit:
And my Zabbix Server is reporting that the Zabbix agent running inside the Pihole and Proxmox Backup NAS VMs isn't answering. So maybe somehow bhyve is stealing the RAM even if the three kvm processes are looking fine without consuming too much RAM?
 

Attachments

  • log.txt
    48.4 KB · Views: 204

Samuel Tai

Never underestimate your own stupidity
Moderator
Joined
Apr 24, 2020
Messages
5,399
You're worrying over nothing. ARC has nothing to do with the Services memory, as it's counted in the Cache section. What you're seeing is Python's dynamic memory allocation and garbage collection. The TrueNAS middleware runs on Python 3.9, so as jobs are spawned, tasks run, alerts sent, etc., the Services section will expand and contract as necessary.
 

Dunuin

Contributor
Joined
Mar 7, 2013
Messages
110
But something is still bloating up the services RAM to nearly 100% forcing the ARC to shink from 20GB to 1GB. I'm just running 4.5GB of VMs. Proxmox services like SMB and NFS (excluding the 3 VMs) shoudn't use 25GB of RAM. Its just a homeserver with only one person accessing it at a time.
So the 11-12GB of services + 18-19GB ARC that I normally see sound reasonable but not that climb to 31GB services + 1GB ARC.
 
Last edited:

Samuel Tai

Never underestimate your own stupidity
Moderator
Joined
Apr 24, 2020
Messages
5,399
Again, it's not a concern, as ARC will grab back whatever it needs.
 

HoneyBadger

actually does care
Administrator
Moderator
iXsystems
Joined
Feb 6, 2014
Messages
5,112
Again, it's not a concern, as ARC will grab back whatever it needs.
Burning 20GB of RAM on "services" and choking ARC to 1GB is definitely a concern in my mind.

@Dunuin you can try htop for a slightly friendlier way to break things down, including a default column of "percentage of memory consumed" - sort by that (should be the default, F6 if not) and find your offender the next time the Services usage rockets up.
 

Dunuin

Contributor
Joined
Mar 7, 2013
Messages
110
I also tried to create a new bridge "bridge49" so I can add the Proxmox Backup Server VM to bridge49 instead of vlan49 but no matter what I try I always get this error message when I click "test changes":
Code:
Error: Traceback (most recent call last):
  File "/usr/local/lib/python3.9/site-packages/middlewared/plugins/network.py", line 747, in commit
    await self.sync()
  File "/usr/local/lib/python3.9/site-packages/middlewared/plugins/network.py", line 1833, in sync
    await self.middleware.call('interface.bridge_setup', bridge)
  File "/usr/local/lib/python3.9/site-packages/middlewared/main.py", line 1241, in call
    return await self._call(
  File "/usr/local/lib/python3.9/site-packages/middlewared/main.py", line 1209, in _call
    return await self.run_in_executor(prepared_call.executor, methodobj, *prepared_call.args)
  File "/usr/local/lib/python3.9/site-packages/middlewared/main.py", line 1113, in run_in_executor
    return await loop.run_in_executor(pool, functools.partial(method, *args, **kwargs))
  File "/usr/local/lib/python3.9/site-packages/middlewared/utils/io_thread_pool_executor.py", line 25, in run
    result = self.fn(*self.args, **self.kwargs)
  File "/usr/local/lib/python3.9/site-packages/middlewared/plugins/interface/bridge.py", line 53, in bridge_setup
    member_iface.mtu = mtu
  File "netif.pyx", line 773, in netif.NetworkInterface.mtu.__set__
OSError: [Errno 22] Invalid argument

During handling of the above exception, another exception occurred:

Traceback (most recent call last):
  File "/usr/local/lib/python3.9/site-packages/middlewared/main.py", line 137, in call_method
    result = await self.middleware._call(message['method'], serviceobj, methodobj, params, app=self,
  File "/usr/local/lib/python3.9/site-packages/middlewared/main.py", line 1198, in _call
    return await methodobj(*prepared_call.args)
  File "/usr/local/lib/python3.9/site-packages/middlewared/schema.py", line 973, in nf
    return await f(*args, **kwargs)
  File "/usr/local/lib/python3.9/site-packages/middlewared/plugins/network.py", line 750, in commit
    await self.rollback()
  File "/usr/local/lib/python3.9/site-packages/middlewared/utils/io_thread_pool_executor.py", line 25, in run
    result = self.fn(*self.args, **self.kwargs)
  File "/usr/local/lib/python3.9/site-packages/middlewared/plugins/interface/bridge.py", line 53, in bridge_setup
    member_iface.mtu = mtu
  File "netif.pyx", line 773, in netif.NetworkInterface.mtu.__set__
OSError: [Errno 22] Invalid argument


Someone know what could cause this error? Looks like it has something to do with MTU but it appearsin both cases (if I leave the MTU default to 1500 or changing it to 9000).

Like I already have written the NIC mlxen0 is set to 9000MTU. The vlan interface "vlan49" is also set to 9000 MTU and I tried to vreate a new bridge "bridge49" that is bridged to "vlan49".

Edit:
If I try to edit already existing bridges I get the same error.
 
Last edited:

revengineer

Contributor
Joined
Oct 27, 2019
Messages
193
There is somewhere a serious memory leak in TrueNAS 12. I have reported a similar issue here. In my case services grew to ~70GB; that's not normal!!! It's not ARC related. For me the issue occurred after stopping and restarting VMs, so it could be bhyve. But perhaps is also could be in Python code. A memory leak related to the latter has been fixed and I am waiting for U5 to see whether this improves. Otherwise I am at a loss because I do not know how to track down the issue.
 

olddog9

Dabbler
Joined
Apr 23, 2021
Messages
28
Dunuin,

Thank you for such a great reply. Why is it great? Answer; it was descriptive, detailed, organized, and focused on the event.
Since my last appearance here ... I've puzzled a bit more on this ... and that means I might have another question. (:^))

I looked at the log.txt file you shared. No entries 'appear' related to this memory behavior.
However, there is an entry dated yesterday July 23 5:32 pm ... a secondary issue: "UPS Powerwalker@localhost:3493 battery is low".
Yep, more work for you.

Now back to the immediate concern ... Go view your system log /var/log/messages and correlate events day & time with memory graphs.
Read all other logs that may be relevant. Correlate disk activity to the same start & stop time and duration of the memory event.

Now for a SURPRISE ! (No, not a solution, yet).

A new TrueNAS system at my location ... is doing the SAME. The server is a one month old Mini X+ with 64GB running TrueNAS 12 U4.1.
Disks = The TrueNAS boot (nvme) and four (4) Western Digital hard disks currently configured as two mirrors = two pools.
It runs flawlessly. No problems or errors. Nice electrified box!

Until yesterday, I never noticed any performance issues or oddities. HOWEVER, when I expanded the time line on the memory graph, I see the SAME memory behavior ... Free memory drops (like a cliff) and Wired memory increases to near max memory. Seven (7) events since July 4.
For each event ... this system is essentially doing nothing ... no major I/O, no pool scrubs, no VMs running, no SMB or NFS file sharing. The box is essentially sitting idle, happily waiting for my next test or experiment.

The clue I'm chasing now .... is the system log (syslog-ng). The TrueNAS box is currently set to use my first pool as the 'System Dataset Pool'.
Since I have two pools, I compared the I/O of each mirror (viewed I/O on one disk from each pool). There seems to be a correlation with 'the memory event' to I/O on the 'System Dataset Pool'. At this moment, I'm still trying to make sense of this. For temporary troubleshooting purposes, I might send the system log to the boot drive, or install a fifth disk (a small size hard disk) to retain the system log. After that change, if the TIME& duration of the memory event roughly MATCHES the I/O TIME and duration on newly added fifth disk, then we may be on to something. Or I may be chasing ghosts.

Go check your logs !

RevEngineer - I read the post you linked ... sounds very similar.

Maybe HoneyBadger or Samuel have more and better guidance.
I must leave now.
 

Dunuin

Contributor
Joined
Mar 7, 2013
Messages
110
I looked at the log.txt file you shared. No entries 'appear' related to this memory behavior.
However, there is an entry dated yesterday July 23 5:32 pm ... a secondary issue: "UPS Powerwalker@localhost:3493 battery is low".
Yep, more work for you.
Thanks but I'm aware of that. Its a 800VA UPS capable of outputing 480W. Normally attached servers are using around 200W but if it goes a little bit up (like 250W) the UPS complains with a "battery is low" (even if it is not running on battery) because the the UPS calculated that the battery wouldn't be able to keep up for 5 minutes with that load. So I'm just ignoring it because the servers don't need 5 minutes to shutdown.

The clue I'm chasing now .... is the system log (syslog-ng). The TrueNAS box is currently set to use my first pool as the 'System Dataset Pool'.
Since I have two pools, I compared the I/O of each mirror (viewed I/O on one disk from each pool). There seems to be a correlation with 'the memory event' to I/O on the 'System Dataset Pool'. At this moment, I'm still trying to make sense of this. For temporary troubleshooting purposes, I might send the system log to the boot drive, or install a fifth disk (a small size hard disk) to retain the system log. After that change, if the TIME& duration of the memory event roughly MATCHES the I/O TIME and duration on newly added fifth disk, then we may be on to something. Or I may be chasing ghosts.
Here the "system dataset pool" is set to "freenas-boot", so by mirrored system SSDs are used. The syslog checkbox is enabled there. And the syslog is setup to log to my external graylog VM.
 

olddog9

Dabbler
Joined
Apr 23, 2021
Messages
28
Good you know about the UPS battery.

As for the system log concern, your current config ... suggests system logging is not related to the memory concern.
So I appear to being chasing a ghost there.

This is a 'production' system ? If NOT a production system, then one approach to isolating the cause is slowly shutdown applications or services until the memory event disappears. Yes, I know that is rather obvious ... eliminate all possible variables ... even the ones you least suspect.

-Or- Begin again. Save your data and install a fresh copy of TrueNAS 12.

Once again, ... this memory behavior FIRST appeared immediately AFTER the upgrade from 11 to 12.0 U4.1 ?

I'm starting to lean back toward the ARC tuning mentioned above.
The openZFS developers have changed some of the ARC behavior since the release date of TrueNAS 11.
Since you are familiar with the arc_summary script, you probably have read the following ....

old 2008 but informative => http://dtrace.org/blogs/brendan/2012/01/09/activity-of-the-zfs-arc/
ARC tunables in newest upstream code => https://github.com/openzfs/zfs/blob/master/module/zfs/arc.c
 

revengineer

Contributor
Joined
Oct 27, 2019
Messages
193
@olddog9 Perhaps you have overlooked @Samuel Tai comments above. I quote: "ARC has nothing to do with Services memory." ARC is part of the ZFS Cache pie shown in the dashboard. There may be a secondary issue resulting from ARC getting starved as a result of Services using and leaking memory, but it is not the root cause of the OP's problems.
 

Dunuin

Contributor
Joined
Mar 7, 2013
Messages
110
I already disabled FTP, Rsync, SMART, SNMP and shutdown all 3 VMs. I can't disable SMB/NFS/UPS because other servers are relying on this. And I don't want to disable SSH.

Next I will try to delete and recreate all network interfaces. Network is working fine (except that the 10Gbit NIC can'T recieve CARP packets) but TrueNAS won't let me change any network settings because it aborts with errors. So maybe the network is causing the RAM problems.
 
Last edited:

revengineer

Contributor
Joined
Oct 27, 2019
Messages
193
If it's a memory leak then it results from memory not being properly released after use. Shutting down the application alone will not help, you need to reboot as well. My guess is that it is related to VMs or SMB. I you can live without your VMs for a couple of days, you can turn off autostart for these and reboot. Then wait and see. I agree that turning of SMB is a pain for most because this is why we are running the server in the first place.
 

olddog9

Dabbler
Joined
Apr 23, 2021
Messages
28
revengineer - Shutting down applications is not intended to help, mitigate, or solve the problem.

The shutdowns are intended to aid in diagnosing the problem ... by isolating ... and eventually identifying the source cause.

Yes, Samuel Tai may indeed be exactly correct. I agree this memory behavior ... may be the expected behavior of the ARC code.
This may be ... much to do ...about nothing.

However, CLEARLY something has changed for Dunuin's server since migrating from FreeNAS 11 to TrueNAS 12.
Also, I see this SAME behavior on a brand new TrueNAS Mini X+.
We want to know ... What changed? Why? Is this memory behavior benign or a symptom of configuration, implementation, or code design?

This is enough to warrant further investigation and maybe a friendly support call.

There are gaps in my understanding of the ARC, so maybe I have an unstated assumption about parts of ARC operations. I'm reading more and experimenting on ZFS based OSs to improve my understanding. Growing the ARC is ok. But to near max memory ? Seems excessive to me. Sun Microsystems and Oracle documents suggest ARC be sized about 1/32 of total RAM. (not a hard rule, only a reasonable ratio) If that is correct then 1GB or 2GB ARC should be sufficient on Dunuin's server.
 

revengineer

Contributor
Joined
Oct 27, 2019
Messages
193
revengineer - Shutting down applications is not intended to help, mitigate, or solve the problem.
I get that. But shutting down the rogue application may not be releasing the memory if its leaked memory, so a reboot is the only way to find out which application or service causes the issue.
 

Dunuin

Contributor
Joined
Mar 7, 2013
Messages
110
There are gaps in my understanding of the ARC, so maybe I have an unstated assumption about parts of ARC operations. I'm reading more and experimenting on ZFS based OSs to improve my understanding. Growing the ARC is ok. But to near max memory ? Seems excessive to me. Sun Microsystems and Oracle documents suggest ARC be sized about 1/32 of total RAM. (not a hard rule, only a reasonable ratio) If that is correct then 1GB or 2GB ARC should be sufficient on Dunuin's server.
I read several rule of thumbs on how to dimension the ARC.
1.) 4GB + 1GB per 1TB of RAW storage (in that case it would be 38GB ARC here)
2.) 1GB per 1TB of RAW storage (in that case it would be 34GB)
3.) official TrueNAS hardware requirement would be 1GB per disk (in that case it would be 11GB)
4.) as much RAM as possible for best performance (in that case its 32GB because my board can't use more ;))

Best way to see if the ARC is big/small enough should be to run arc_summary and look how good the hit rates are and if the dnode/metadata caches are at the limit. Hitrate here is 99.3% and dnode /metadata has enough free capacity so around 20GB ARC should be fine here.

I get that. But shutting down the rogue application may not be releasing the memory if its leaked memory, so a reboot is the only way to find out which application or service causes the issue.
I already disabled autostart everywhere and will reboot the server later after all transfers are finished. But I don't think that it is a memory leak because the sysvices RAM will shrink by itself to the normal value after some time without me doing anything. If it would be a memory leak it should block the RAM permanently until a reboot right?
 
Top