See IOPS and/or throughput by file?

Status
Not open for further replies.

David E

Contributor
Joined
Nov 1, 2013
Messages
119
All-
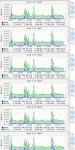
I'm currently seeing a consistent ~1.5MB/s write to all of the disks in my pool, and I'd like to know which file(s) are the primary culprits. Is there a utility or dtrace script that can show the equivalent of "systat -iostat", but by file rather than device? These writes should also all be (presumably) coming in via NFS from VMware, so something that does the same thing for NFS could also potentially help.

Thanks in advance!
 

Attachments

  • graphs.png
    graphs.png
    208.3 KB · Views: 523

zambanini

Patron
Joined
Sep 11, 2013
Messages
479
do an esxtop from the client side. with u you should see more
 

tvsjr

Guru
Joined
Aug 29, 2015
Messages
959
lsof will show you open files, which might get you close - however, it's just going to show nfsd having the vmdk open, which won't tell you much. If you're just trying to identify which VM is doing it, go look at your disk IO graphs in the vSphere client.
 

David E

Contributor
Joined
Nov 1, 2013
Messages
119
do an esxtop from the client side. with u you should see more
lsof will show you open files, which might get you close - however, it's just going to show nfsd having the vmdk open, which won't tell you much. If you're just trying to identify which VM is doing it, go look at your disk IO graphs in the vSphere client.

Thanks to both of you for the suggestions. esxtop was interesting, but didn't show me any clear VM dominating the writes, although it is possible that there are a bunch of small writes from all running VMs that add up to ~1.5MB/s. Similar issue with vSphere's web client.

Interestingly lsof didn't show any open files in my ZFS mounts, and lsof -N was completely empty. I did get an error when launching it, "lsof: WARNING: compiled for FreeBSD release 9.3-RELEASE-p25; this is 9.3-RELEASE-p28.", but it showed other library files open, so I don't know what the issue is.
 

David E

Contributor
Joined
Nov 1, 2013
Messages
119
Before I forget, I cobbled together a Dtrace script that works in FreeNAS that at 10 second intervals will print all written-to files, and their average write rate across that time frame. This was extremely helpful to me in tracking down stray VMs that should have been idle but had run-away processes doing a ton of file IO. The script can certainly be cleaned up and enhanced (ie to also show reads), but it is a good starting point.

https://gist.github.com/daviderickson/e1466da453fbcee3647cd217c9889a43
 

Nigel Dunning

Dabbler
Joined
May 1, 2015
Messages
12
Before I forget, I cobbled together a Dtrace script that works in FreeNAS that at 10 second intervals will print all written-to files, and their average write rate across that time frame. This was extremely helpful to me in tracking down stray VMs that should have been idle but had run-away processes doing a ton of file IO. The script can certainly be cleaned up and enhanced (ie to also show reads), but it is a good starting point.

https://gist.github.com/daviderickson/e1466da453fbcee3647cd217c9889a43
Hi

I just wanted to mention this is an *incredibly* powerful script and something I've wanted on FreeNAS for a long time but did not have the DTrace chops to make it myself, I am extremely grateful you made this.
I feel iX systems should implement this natively into FreeNAS (and of course give you credit), maybe into a GUI with some extra analytics.
Being able to see this data gives so much better insight into that is actually happening on the system.

Another file system I use at work Qumulo has very powerful analytics based around exactly this, seeing the interaction with files, throughput and IOPS.
 
Status
Not open for further replies.
Top