natobyte
Cadet
- Joined
- May 10, 2015
- Messages
- 4
I think I broke something while replacing a failed hdd. I took many notes though in hopes that one of you kind and experienced FreeNAS users can help me.
Day 1 - Drive Failures
1 drive has too many errors in my RAIDZ2 volume:
I check zpool status reports a degraded state and the offline drive (ada4).
I remove the drive and mail it back to seagate.
When I reboot the server another disk reports missing
Now Im worried and power off the machine until I can get a replacement drive.
Day2 - Install new HDD
I installed the WD Red and until the evening when I was ready to add it back to the volume.
I check the manual and *DOH* I didnt properly remove the old drive first, so now there is no gui option to "replace" the original missing drive as its not listed in the table.
The Volume Status table lists 2 drives as UNAVAIL: the WD Red and the second failing drive (ada2)
At this point I plan to use the new WD Red to replace the second failing drive (ada2) instead of the original failing drive.
OK- Here's where maybe I broke it-
I shutdown the machine and unplugged the new drive, then restarted, but the server wouldn't connect.
Plugged in a monitor and it says:
Port 2: ST3000DM001-1ER166
S.M.A.R.T Status Bad, Backup and Replace.
Press F1 to Resume...
ok then, I resume and log back into gui
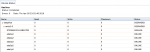
Now the Volume status seems more normal:

It shows only 1 UNAVAIL drive, the second failing drive. But I did not notice that it also says ""Resilver Status: Completed". I dont know if that is significant.
Anyway, I (without rebooting this time) installed the WD Red and the resilvering is initiated.
http://postimg.org/image/51sxvi1b3/
Now the dmesg is scrolling error messages like:
(ada2:ahcich2:0:0:0): CAM status: Uncorrectable parity/CRC error
Retrying command
READ_FPDMA_QUEUED
So I check the zpool status
Day3 - What do I do?
Every time I check the zpool status the percent complete is a different amount
then again 5 min later
I ran "systat -vm" to verify that ada2 is being utilized at max capacity.
Here are the SMART attributes on the drive getting replaced (ada2)
And the new WD red hdd (ada5)
Day 1 - Drive Failures
1 drive has too many errors in my RAIDZ2 volume:
I check zpool status reports a degraded state and the offline drive (ada4).
I remove the drive and mail it back to seagate.
When I reboot the server another disk reports missing
Code:
~> zpool status
  pool: deepblue
 state: DEGRADED
status: One or more devices could not be opened.  Sufficient replicas exist for
    the pool to continue functioning in a degraded state.
action: Attach the missing device and online it using 'zpool online'.
   see: http://illumos.org/msg/ZFS-8000-2Q
  scan: scrub repaired 0 in 0h32m with 0 errors on Sun Apr 10 00:32:57 2016
config:
    NAME                                            STATE     READ WRITE CKSUM
    deepblue                                        DEGRADED     0     0     0
      raidz2-0                                      DEGRADED     0     0     0
        gptid/15425d13-181c-11e5-8529-00259047751d  ONLINE       0     0     0
        gptid/15db69e4-181c-11e5-8529-00259047751d  ONLINE       0     0     0
        gptid/165fbb0a-181c-11e5-8529-00259047751d  ONLINE       0     0     0
        9665275614133904940                         UNAVAIL      0     0     0  was /dev/gptid/16e24a17-181c-11e5-8529-00259047751d
        gptid/17661f3c-181c-11e5-8529-00259047751d  ONLINE       0     0     0
        9790684121614842782                         UNAVAIL      0     0     0  was /dev/gptid/17e6fc25-181c-11e5-8529-00259047751d
errors: No known data errors
Now Im worried and power off the machine until I can get a replacement drive.
Day2 - Install new HDD
I installed the WD Red and until the evening when I was ready to add it back to the volume.
I check the manual and *DOH* I didnt properly remove the old drive first, so now there is no gui option to "replace" the original missing drive as its not listed in the table.
The Volume Status table lists 2 drives as UNAVAIL: the WD Red and the second failing drive (ada2)
At this point I plan to use the new WD Red to replace the second failing drive (ada2) instead of the original failing drive.
OK- Here's where maybe I broke it-
I shutdown the machine and unplugged the new drive, then restarted, but the server wouldn't connect.
Plugged in a monitor and it says:
Port 2: ST3000DM001-1ER166
S.M.A.R.T Status Bad, Backup and Replace.
Press F1 to Resume...
ok then, I resume and log back into gui
Now the Volume status seems more normal:
It shows only 1 UNAVAIL drive, the second failing drive. But I did not notice that it also says ""Resilver Status: Completed". I dont know if that is significant.
Anyway, I (without rebooting this time) installed the WD Red and the resilvering is initiated.
http://postimg.org/image/51sxvi1b3/
Now the dmesg is scrolling error messages like:
(ada2:ahcich2:0:0:0): CAM status: Uncorrectable parity/CRC error
Retrying command
READ_FPDMA_QUEUED
So I check the zpool status
Code:
~/scripts> zpool status -x
  pool: deepblue
 state: ONLINE
status: One or more devices is currently being resilvered.  The pool will
    continue to function, possibly in a degraded state.
action: Wait for the resilver to complete.
  scan: resilver in progress since Fri Apr 29 00:36:49 2016
        10.3G scanned out of 721G at 51.8M/s, 3h53m to go
        1.69G resilvered, 1.43% done
config:
    NAME                                            STATE     READ WRITE CKSUM
    deepblue                                        ONLINE       0     0     0
      raidz2-0                                      ONLINE       0     0     0
        gptid/15425d13-181c-11e5-8529-00259047751d  ONLINE       0     0     0
        gptid/15db69e4-181c-11e5-8529-00259047751d  ONLINE       0     0     0
        gptid/165fbb0a-181c-11e5-8529-00259047751d  ONLINE       0     0     0
        gptid/16e24a17-181c-11e5-8529-00259047751d  ONLINE     659 5.79K     2  (resilvering)
        gptid/17661f3c-181c-11e5-8529-00259047751d  ONLINE       0     0     0
        gptid/125aaef4-0ddd-11e6-a9d9-00259047751d  ONLINE       0     0     0  (resilvering)
Day3 - What do I do?
Every time I check the zpool status the percent complete is a different amount
Code:
scan: resilver in progress since Fri Apr 29 07:12:32 2016
        7.50G scanned out of 721G at 175M/s, 1h9m to go
        2.44G resilvered, 1.04% done
then again 5 min later
Code:
scan: resilver in progress since Fri Apr 29 07:16:59 2016
        207M scanned out of 721G at 25.8M/s, 7h56m to go
        54.3M resilvered, 0.03% done
I ran "systat -vm" to verify that ada2 is being utilized at max capacity.
Here are the SMART attributes on the drive getting replaced (ada2)
Code:
SMART Attributes Data Structure revision number: 10
Vendor Specific SMART Attributes with Thresholds:
ID# ATTRIBUTE_NAME          FLAG     VALUE WORST THRESH TYPE      UPDATED  WHEN_FAILED RAW_VALUE
  1 Raw_Read_Error_Rate     0x000f   111   099   006    Pre-fail  Always       -       35555616
  3 Spin_Up_Time            0x0003   094   094   000    Pre-fail  Always       -       0
  4 Start_Stop_Count        0x0032   100   100   020    Old_age   Always       -       29
  5 Reallocated_Sector_Ct   0x0033   100   100   010    Pre-fail  Always       -       0
  7 Seek_Error_Rate         0x000f   060   055   030    Pre-fail  Always       -       55848810753
  9 Power_On_Hours          0x0032   096   096   000    Old_age   Always       -       3773
 10 Spin_Retry_Count        0x0013   100   100   097    Pre-fail  Always       -       0
 12 Power_Cycle_Count       0x0032   100   100   020    Old_age   Always       -       29
183 Runtime_Bad_Block       0x0032   100   100   000    Old_age   Always       -       0
184 End-to-End_Error        0x0032   100   100   099    Old_age   Always       -       0
187 Reported_Uncorrect      0x0032   100   100   000    Old_age   Always       -       0
188 Command_Timeout         0x0032   100   001   000    Old_age   Always       -       125 125 25514
189 High_Fly_Writes         0x003a   099   099   000    Old_age   Always       -       1
190 Airflow_Temperature_Cel 0x0022   063   052   045    Old_age   Always       -       37 (Min/Max 35/37)
191 G-Sense_Error_Rate      0x0032   100   100   000    Old_age   Always       -       0
192 Power-Off_Retract_Count 0x0032   100   100   000    Old_age   Always       -       2
193 Load_Cycle_Count        0x0032   100   100   000    Old_age   Always       -       61
194 Temperature_Celsius     0x0022   037   048   000    Old_age   Always       -       37 (0 18 0 0 0)
197 Current_Pending_Sector  0x0012   100   100   000    Old_age   Always       -       0
198 Offline_Uncorrectable   0x0010   100   100   000    Old_age   Offline      -       0
199 UDMA_CRC_Error_Count    0x003e   200   131   000    Old_age   Always       -       107515
240 Head_Flying_Hours       0x0000   100   253   000    Old_age   Offline      -       3771h+48m+38.255s
241 Total_LBAs_Written      0x0000   100   253   000    Old_age   Offline      -       13924507252
242 Total_LBAs_Read         0x0000   100   253   000    Old_age   Offline      -       36418178742
And the new WD red hdd (ada5)
Code:
SMART Attributes Data Structure revision number: 16
Vendor Specific SMART Attributes with Thresholds:
ID# ATTRIBUTE_NAME          FLAG     VALUE WORST THRESH TYPE      UPDATED  WHEN_FAILED RAW_VALUE
  1 Raw_Read_Error_Rate     0x002f   100   253   051    Pre-fail  Always       -       0
  3 Spin_Up_Time            0x0027   100   253   021    Pre-fail  Always       -       0
  4 Start_Stop_Count        0x0032   100   100   000    Old_age   Always       -       2
  5 Reallocated_Sector_Ct   0x0033   200   200   140    Pre-fail  Always       -       0
  7 Seek_Error_Rate         0x002e   200   200   000    Old_age   Always       -       0
  9 Power_On_Hours          0x0032   100   100   000    Old_age   Always       -       15
 10 Spin_Retry_Count        0x0032   100   253   000    Old_age   Always       -       0
 11 Calibration_Retry_Count 0x0032   100   253   000    Old_age   Always       -       0
 12 Power_Cycle_Count       0x0032   100   100   000    Old_age   Always       -       2
192 Power-Off_Retract_Count 0x0032   200   200   000    Old_age   Always       -       0
193 Load_Cycle_Count        0x0032   200   200   000    Old_age   Always       -       9
194 Temperature_Celsius     0x0022   117   116   000    Old_age   Always       -       33
196 Reallocated_Event_Count 0x0032   200   200   000    Old_age   Always       -       0
197 Current_Pending_Sector  0x0032   200   200   000    Old_age   Always       -       0
198 Offline_Uncorrectable   0x0030   100   253   000    Old_age   Offline      -       0
199 UDMA_CRC_Error_Count    0x0032   200   200   000    Old_age   Always       -       0
200 Multi_Zone_Error_Rate   0x0008   100   253   000    Old_age   Offline      -       0