
Hi all,
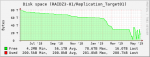
I've got a pair of identical FreeNAS servers running 11.1-U2 with one acting as a the primary and the other acting as a replication target for snapshots. For the past few months, replication has been failing for the original dataset (started with a 40TB quota but has since been increased to 57TB). Around the time of the first quota increase on the first dataset, a second dataset was created (started with a 10TB quota but has since been increased to 20TB). I suspect one or both of these actions (quota increases and/or creation of the second dataset) is to blame for the original dataset failing to replication successfully. During replication attempts, I see alerts for the storage on the target volume rising consistently until the replication attempt finally fails. I'm hoping someone can help validate this theory or point me in the direction of the true culprit and a way to overcome the issue. Attached are reporting graphs from both servers. I'm not sure if it's relevant, but the target server shows a separate graph for the second dataset, but not the original one. I suppose there could be expected reasons for this that would result in it being a red herring (e.g. due to the fact the original dataset has failed to replicate over for enough time that none of its snapshots are present on the target volume) but the dataset itself does show up in the storage view so I figured I'd mention it just in case it's helpful. Thanks in advance.
I've got a pair of identical FreeNAS servers running 11.1-U2 with one acting as a the primary and the other acting as a replication target for snapshots. For the past few months, replication has been failing for the original dataset (started with a 40TB quota but has since been increased to 57TB). Around the time of the first quota increase on the first dataset, a second dataset was created (started with a 10TB quota but has since been increased to 20TB). I suspect one or both of these actions (quota increases and/or creation of the second dataset) is to blame for the original dataset failing to replication successfully. During replication attempts, I see alerts for the storage on the target volume rising consistently until the replication attempt finally fails. I'm hoping someone can help validate this theory or point me in the direction of the true culprit and a way to overcome the issue. Attached are reporting graphs from both servers. I'm not sure if it's relevant, but the target server shows a separate graph for the second dataset, but not the original one. I suppose there could be expected reasons for this that would result in it being a red herring (e.g. due to the fact the original dataset has failed to replicate over for enough time that none of its snapshots are present on the target volume) but the dataset itself does show up in the storage view so I figured I'd mention it just in case it's helpful. Thanks in advance.
Attachments
-
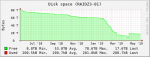 01.primary-RAIDZ3-01.png14.9 KB · Views: 590
 -
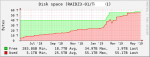 02.primary-RAIDZ3-01-original-dataset.png23.2 KB · Views: 578
 -
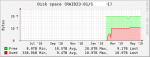 03.primary-RAIDZ3-01-second-dataset.png20.9 KB · Views: 622
 -
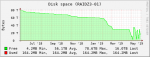 04.replication-target-RAIDZ3-01.png15.1 KB · Views: 580
 -
 05.repllication-target-RAIDZ3-01-replication-target.png16.3 KB · Views: 586
 -
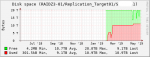 06.replication-target-RAIDZ3-01-replication-dataset2.png24.3 KB · Views: 605