plugin_dispatch_values: Low water mark reached. Dropping 100% of metrics.

bstev

Explorer
Joined
Dec 16, 2016
Messages
53
I am running a fresh and clean install on a R720 with ESXi 6.7U3 and TrueNAS-13.0-U3.1. Using a cross-flashed H710P mini, and H200e. All of the setup went fine and I have it configured enough to do some testing for stability and such. And that is when this issue started happening. I have an R720xd with a very similar setup that has been flawless for years and has been running TruNAS12 for sometime now.

I originally had ESXi and TrueNAS sharing the same management NIC and I would notice overnight that I could no longer access the web interface for either one. Sometimes ESXi would start to load something, but never any response from TrueNAS web interface. A day or two ago I split the management interfaces out to separate network connections and looked over all the ESXi network settings to make sure they matched my stable instance on the R720xd.

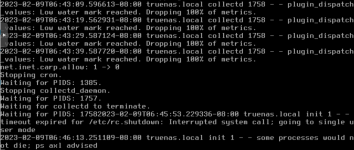
Today the ESXi interface is working properly, but TruNAS web interface will not load. From the ESXi console I seen this message over and over "plugin_dispatch_values: Low water mark reached. Dropping 100% of metrics." I then used WinSCP to try and grab the log files form TrueNAS. I could login through WinSCP, but it would not pull any of the files, WinSCP would just hang there trying to download it.

At this point I started a shutdown on TrueNAS from the ESXi guest shutdown. It struggled with a few things and took some time but then hung hard on the last of this screen shot.
Screenshot 2022-11-23 201700.jpg


I ended up doing a hard reset and it is back up and running now so I will grab the logs and look through them. Any certain log file I should expect to find the cause in from what is shown above? I do also read about RAM possibly causing this issue, so sounds like a RAM test may be a good idea too.
 
Last edited:

bstev

Explorer
Joined
Dec 16, 2016
Messages
53
I dug through the logs and not sure I found a smoking gun, unless something here stands out to any of you. I filtered through them looking for warnings and errors and threw those down below. Oh, and I currently have the system doing a hardware test using the Dell Lifecycle controller. So far no issues, but still on the CPU and memory.

Console.log
Nov 19 17:09:26 truenas /etc/rc: WARNING: failed to start rrdcached

debug
Nov 19 17:16:55 truenas 1 2022-11-19T17:16:55.676322-08:00 truenas.local collectd 1259 - - plugin = syslog, key = LogLevel, value = err
Nov 20 09:24:53 truenas 1 2022-11-20T09:24:53.726799-06:00 truenas.steversonlanding.com collectd 1741 - - plugin = syslog, key = LogLevel, value = err

messages
Nov 21 18:51:59 truenas WARNING: Device "psm" is Giant locked and may be deleted before FreeBSD 14.0.

middlewared.log
[2022/11/19 17:09:07] (WARNING) middlewared_truenas.plugins.enclosure_.enclosure_class._parse_elements():82 - Unknown element type: 128 for 'ses0'
[2022/11/19 17:09:17] (WARNING) middlewared.plugins.service_.services.base_freebsd.freebsd_service():140 - Failed to forcestop collectd-daemon with code 1 with error 'collectd_daemon not running? (check /var/run/collectd-daemon.pid).\n'
[2022/11/19 17:09:17] (WARNING) middlewared.plugins.service_.services.base_freebsd.freebsd_service():142 - rrdcached forcestop failed with code 1: 'rrdcached not running? (check /var/run/rrdcached.pid).\n'
[2022/11/19 17:13:38] (WARNING) UpdateService.get_trains_data():102 - Failed to retrieve trains redirection

middlewared.log update service issue. I put this out separate because my other TrueNAS box had update server issues too, so maybe normal right now.
Traceback (most recent call last):
File "/usr/local/lib/python3.9/site-packages/urllib3/connectionpool.py", line 699, in urlopen
httplib_response = self._make_request(
File "/usr/local/lib/python3.9/site-packages/urllib3/connectionpool.py", line 382, in _make_request
self._validate_conn(conn)
File "/usr/local/lib/python3.9/site-packages/urllib3/connectionpool.py", line 1010, in _validate_conn
conn.connect()
File "/usr/local/lib/python3.9/site-packages/urllib3/connection.py", line 416, in connect
self.sock = ssl_wrap_socket(
File "/usr/local/lib/python3.9/site-packages/urllib3/util/ssl_.py", line 449, in ssl_wrap_socket
ssl_sock = _ssl_wrap_socket_impl(
File "/usr/local/lib/python3.9/site-packages/urllib3/util/ssl_.py", line 493, in _ssl_wrap_socket_impl
return ssl_context.wrap_socket(sock, server_hostname=server_hostname)
File "/usr/local/lib/python3.9/ssl.py", line 501, in wrap_socket
return self.sslsocket_class._create(
File "/usr/local/lib/python3.9/ssl.py", line 1041, in _create
self.do_handshake()
File "/usr/local/lib/python3.9/ssl.py", line 1310, in do_handshake
self._sslobj.do_handshake()
ssl.SSLCertVerificationError: [SSL: CERTIFICATE_VERIFY_FAILED] certificate verify failed: certificate has expired (_ssl.c:1134)

During handling of the above exception, another exception occurred:

Traceback (most recent call last):
File "/usr/local/lib/python3.9/site-packages/requests/adapters.py", line 439, in send
resp = conn.urlopen(
File "/usr/local/lib/python3.9/site-packages/urllib3/connectionpool.py", line 755, in urlopen
retries = retries.increment(
File "/usr/local/lib/python3.9/site-packages/urllib3/util/retry.py", line 574, in increment
raise MaxRetryError(_pool, url, error or ResponseError(cause))
urllib3.exceptions.MaxRetryError: HTTPSConnectionPool(host='update-master.ixsystems.com', port=443): Max retries exceeded with url: /TrueNAS/trains_redir.json (Caused by SSLError(SSLCertVerificationError(1, '[SSL: CERTIFICATE_VERIFY_FAILED] certificate verify failed: certificate has expired (_ssl.c:1134)')))

During handling of the above exception, another exception occurred:

Traceback (most recent call last):
File "/usr/local/lib/python3.9/site-packages/middlewared/plugins/update_/trains_freebsd.py", line 100, in get_trains_data
redir_trains = self._get_redir_trains()
File "/usr/local/lib/python3.9/site-packages/middlewared/plugins/update_/trains_freebsd.py", line 142, in _get_redir_trains
r = requests.get(
File "/usr/local/lib/python3.9/site-packages/requests/api.py", line 76, in get
return request('get', url, params=params, **kwargs)
File "/usr/local/lib/python3.9/site-packages/requests/api.py", line 61, in request
return session.request(method=method, url=url, **kwargs)
File "/usr/local/lib/python3.9/site-packages/requests/sessions.py", line 542, in request
resp = self.send(prep, **send_kwargs)
File "/usr/local/lib/python3.9/site-packages/requests/sessions.py", line 655, in send
r = adapter.send(request, **kwargs)
File "/usr/local/lib/python3.9/site-packages/requests/adapters.py", line 514, in send
raise SSLError(e, request=request)
requests.exceptions.SSLError: HTTPSConnectionPool(host='update-master.ixsystems.com', port=443): Max retries exceeded with url: /TrueNAS/trains_redir.json (Caused by SSLError(SSLCertVerificationError(1, '[SSL: CERTIFICATE_VERIFY_FAILED] certificate verify failed: certificate has expired (_ssl.c:1134)')))
 

bstev

Explorer
Joined
Dec 16, 2016
Messages
53
I got the same type of behavior yesterday with the TrueNAS GUI not loading. I also notice the ESXi GUI was not fully loading, but I could SSH into ESXi and was not able into TrueNAS.

I was able to do the shutdown command from ESXi to TrueNAS and it took probably 5 minutes before ESXi started responding properly again, but when it did I was left with the same screen shot as at the top of this thread. And just hung there.

After a few minutes I did a force restart on the TrueNAS VM and then went to check logs. The logs of what I seen on the console screen, did not get written to the log files. So I guess that is why I am having trouble seeing in the log as to what happens each time.

My first thought is the two datastores I have the TrueNAS virtual disks mirrored across, but I am not finding any proof that anything goes wrong with them. Also having trouble knowing where else to look for the cause. I would say this happens on average about every 3 days so far and has happened at least 3 times now.
 

jomom

Cadet
Joined
Feb 8, 2023
Messages
5
I've Started to experience this in the last week.

I'm installed on baremetal though.

Did you ever find a solution?
A reboot seems to satisfy the system for about a day, and then the error appears on Stdout once every 10seconds or so
 

jomom

Cadet
Joined
Feb 8, 2023
Messages
5
looks like I might be having issues with the drive/pool that the iocage jails are installed on so I've moved them to the next pool using the instructions here:

if all goes well tomorrow, it must just be a bad drive
 

bstev

Explorer
Joined
Dec 16, 2016
Messages
53
I ended up changing my configuration and have not had the issue since. Honestly can not tell you what the cause was for me. I am not using iocage or jails though.

This was also in testing of the system before moving my data onto it. When testing, I was using some extra drives I had around, so some did have smart errors and such during that time.
 

anton612

Cadet
Joined
Feb 9, 2023
Messages
1
I'm having the same issue, though on different hardware. Brand new TrueNAS VM on Proxmox server. I configured TrueNAS last night, trasnferred some files to it, and was unable to access any shares this morning. Logging into the console shows me the attached screenshot. I've tried to reboot and it's been stuck for a half hour so far.

bstev, do you remember exactly what you changed in your configuration that resolved the issue? I also don't have all my data migrated here yet so I still have time to find a different NAS solution, but would prefer to stick with this.
 

Attachments

  • Low_water_mark.png
    Low_water_mark.png
    66 KB · Views: 174

Azeures

Cadet
Joined
Mar 20, 2023
Messages
1
Sorry to barge in. I have the same errors spamming my logs, but I kind'of know the source of it. I wanted to drop all the "Reporting" data that was stored and instead of running "rm -r" in the '/var/db/collectd/rrd/localhost" I ran "rm -rf". After that the issue started spamming the logs and in a week or so it requires an force restart of the server.
Is there a way to recreate all the missing folders/files? Or what should be best way to fix this while keeping all the jails/data?
Thank you.
 

andrwhmmr

Dabbler
Joined
Oct 8, 2017
Messages
13
Sorry to barge in. I have the same errors spamming my logs, but I kind'of know the source of it. I wanted to drop all the "Reporting" data that was stored and instead of running "rm -r" in the '/var/db/collectd/rrd/localhost" I ran "rm -rf". After that the issue started spamming the logs and in a week or so it requires an force restart of the server.
Is there a way to recreate all the missing folders/files? Or what should be best way to fix this while keeping all the jails/data?
Thank you.
Backup your config and stuff and reinstall, would be my suggestion.
 

Manu33

Cadet
Joined
Jun 17, 2023
Messages
1
Hi.
I'm experiencing the same issue.
Log message : plugin_dispatch_values: Low water mark reached. Dropping 100% of metrics.

I've lost all my reporting data few months ago. I firstly thought that it was a bug, expecing an update to solve it. Sadly it never happened.
After many searches, I'm still blocked and I don't understand how to solve it and be able to monitor my system correctly again.
I've tried to delete the rrd files in /var/db/collectd/rrd/localhost. I only deleted the ones in cputemp-0 to cputemp-7.
As a result I only lost part of the cpu temp graph.
I'm lost and I need your help ;)

System info :
Truenas Core 13.0-U5.1
Intel(R) Xeon(R) CPU E3-1245 v5
Motherboard Supermicro X11-SSL
64Gb of RAM
2x120Gb SSD for system pool
2x600Gb SSD for VM pool
4x1.5Tb HD for data pool


Thanks a lot for your help !!
 
Last edited by a moderator:

eptesicus

Dabbler
Joined
Sep 12, 2018
Messages
20
I too am having the same issue on a brand new install of Core 13.0-U5.1. My 40x 10TB pool was imported from a problematic Scale installation. Large file transfers, copies, deletes, cause the system to come to a halt. I can't access SMB, SSH stops responding, and occasionally the console also locks up and the system needs to be reset. I'm on bare metal and am only serving up storage via SMB, using no jails. The system did this again in the middle of writing while trying to delete about 2TB of data from CLI of the system. This did it last night when attempting the same, but over SMB. No performance tuning has been completed yet. I have no L2ARC or SLOG devices on this system. The configuration is still fresh and basic. My data pool is at about 90% used, but am trying to clean up old data and am ordering 8x more disks.

CPU: Intel E5-2630 v4
RAM: 128GB
Chassis: Chenbro NR40700
Mobo: X10SRH-CLN4F
HBA: HP LSI2308-IT
Boot: 2x 200GB SSDs
Data Pool: 40x 10TB in 5x Z1 vdevs.
NIC: CX314A ConnectX-3 Pro dual 40GbE
 

rebo00

Dabbler
Joined
May 29, 2020
Messages
24
Probably not the same issue some of you are having but I had the same symptoms as the original poster.
I had Plex running on the server and that continued to work fine but I couldn't access THE web GUI or the SMB shares on the machine.
Went in the loft and checked and the monitor was showing the same low water mark reached errors which lead me to this post.

I could still interact with the command line but when I tried a reboot it just hung.
Used the reset button and when it came back on it the motherboard wasn't detecting the boot drive so it went straight into BIOS.
Exited out of the BIOS and it rebooted but again not boot drive detected.
Powered it off completely with the power button, powered it back on and it detected the boot drive.

Explains the errors if it was trying to write logs to the boot drive but it couldn't find it. I just don't understand how Plex was still working.

System has been up for about 2months after troubleshooting other stuff with the community.

Motherboard was detecting the other two drives for the IOCage storage so I'm thinking a faulty mobo (specifically the slot the drive is in) or a faulty drive.
Will run some SMART tests on it and let you know if anything stands out but if it happens again ill replace the drive.

Andy
 

rebo00

Dabbler
Joined
May 29, 2020
Messages
24
Just read a reply from danb35 which says "The boot volume is now a live ZFS pool, no matter what the boot device is. ZFS caching means that most of the OS will live in RAM most of the time".
I guess that explains why some parts still worked despite the motherboard dropping the drive from existence :)

Andy
 

logan893

Dabbler
Joined
Dec 31, 2015
Messages
44
I had some entries like these in the log while running the HDD stress test (solnet-array-test-v3.sh), I believe it was during the heavy seek part of the test (6 parallel full-drive reads with dd per HDD all started simultaneously). System dataset on a 2-way mirror HDD under test, all 4 HDD in the system were being stress tested.

I suspect the high load on the HDDs with the system dataset caused that dataset to become somewhat unresponsive and trigger these log entries and some missing metrics data. I wasn't actively doing anything with the GUI or monitoring SMB status so I can't tell if these were affected.

I've since moved the system dataset to my mirrored SSD boot volume, but I have yet to rerun the seek stress test.
 
Top